
Headed in the right direction. Must go faster.
When the rate of job loss began to slow last August, the President said the U.S. economy was “pointed in the right direction.” He was wrong then. The U.S. economy is now headed in the right direction. That’s good news. But it’s getting there way too slowly, so we need to hope that economic and job growth accelerate. If we continue to see GDP and jobs grow at the rate they have over the past few months, it will take many years for the U.S. economy to recover. We need to go much faster.
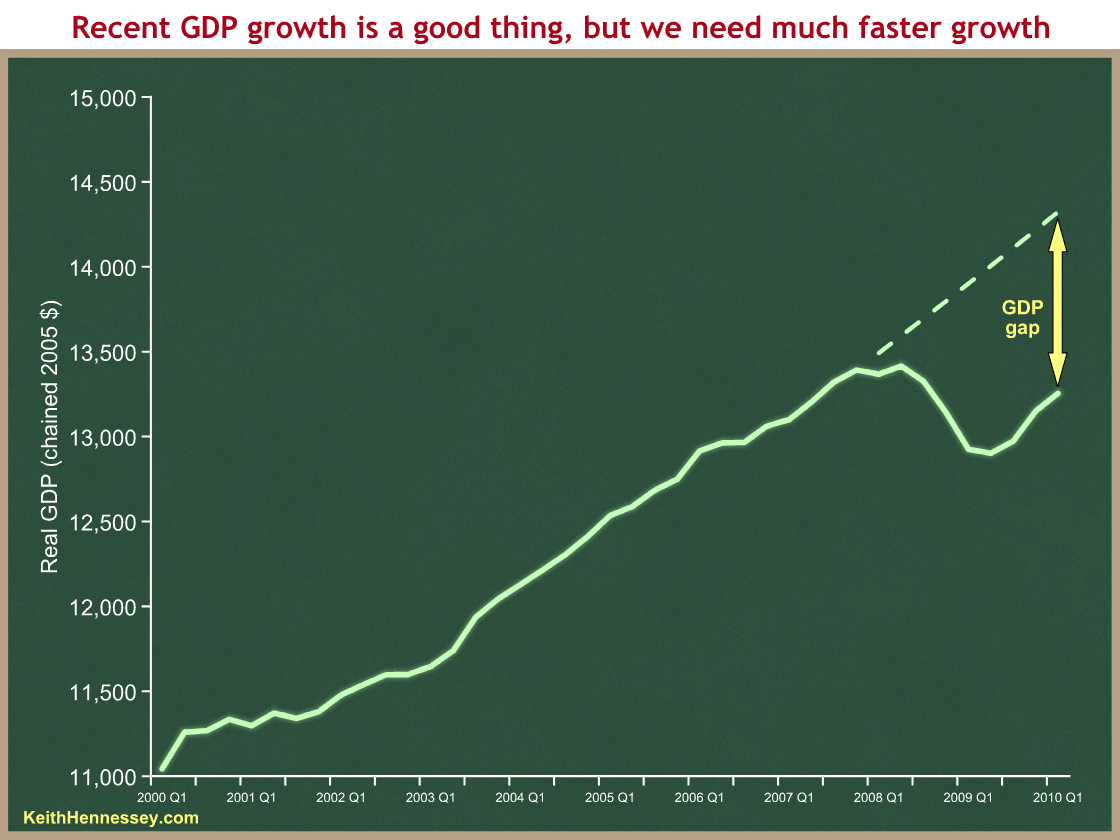
Here is a graph of real GDP over the past ten years (data are from BEA):

You can see the mild recession in Q1-Q2 of 2008, followed by a severe drop beginning in the third quarter of that year. Growth turned positive in the third quarter of 2009 and has grown at a 3% annual rate since then. The upturn is great news, and when the economy is operating near capacity a 3% growth rate is solid. Most economists assume the long-run growth rate of real GDP is a smidge above 3%.
But you can see the enormous gap between where we are and my back-of-the-envelope calculation of where GDP would be were we operating at full employment and full capacity. That’s more than a trillion dollar gap in a $13 (actual) or $14 (potential) trillion economy. There are a lot of idle resources (people and capital) that aren’t being used but could be.
The 3% growth rate over the past three quarters represents the recent upward slope of the solid green line. The problem is that the dotted green line is also growing at 3%, so to close that huge gap we need the solid line to slope upward much more sharply. There are also risks to continued growth – another housing price downturn, the stimulus runs out of juice, employment turns down, Europe implodes. Then again, there are always risks to growth.
If we were to maintain our recent 3% growth rate, the two lines would grow in parallel and we’d never close the gap. We therefore need real GDP growth to accelerate to well over 3% (think 6%-7%) to close that gap in any reasonable timeframe.
I’m trying to learn from smart economists why we’re not bouncing back more sharply. Is it because the recession was caused by a financial crisis, collapsed credit markets, and balance sheet shocks that are still being repaired? Is it policy induced? Has something more fundamental changed in how the U.S. economy recovers from recessions? The 2004 recovery was slow in creating job growth as well.
Since many of my readers operate in a partisan political context, I want to be clear that the recent trend is good news. I also think that, given a near-zero fed funds rate and enormous short-term and long-term budget deficits, there is little the President and Congress can do to dramatically accelerate near-term GDP growth. There are the usual debates about policy uncertainty, size of government, and protectionism, but there isn’t a secret magic wand sitting in the corner, unless you’re comfortable with even more huge fiscal stimulus and pushing budget deficits well above 10% of GDP. I hope Republicans in Washington will resist the temptation to portray the recent recovery as anything other than good.
At the same time, Democrats in DC will be tempted to emphasize the positive trend while downplaying the reality that, while getting stronger, the economy is still far weaker than it could and should be. We can and need to do much better.
Keeping up with the Joneses
Meet the four person Jones family, which after taxes had $100,000 of income last year. For some strange reason, 15-year old Billy Jones is not allowed to work or earn any income. For some even stranger reason, Billy’s parents give him an allowance of about $50 per day, totaling $18,000 last year. Billy’s parents also gave him a credit card with no apparent credit limit. Billy spent $20,000 last year, therefore running up $2,000 of credit card debt. (Billy is spoiled rotten.)
This year the Jones family expects to have $105,000 of after-tax income. Billy announces that he plans to spend $21,000 this year, the same proportion of the total family income (20%) as last year. His parents shrug and increase his allowance to $18,900, the same 18% of total family income as last year. Billy therefore expects to add $2,100 of credit card debt this year. He also announces that when he was five years old he promised his friends he would drive them wherever they wanted once he turned 16, so he expects his spending will soon grow by $2,000 per year. He explains to his parents he’ll just put the gas costs on his credit card if they don’t increase his allowance.
Billy’s parents look at his credit card statements and freak out. They realize that they co-signed his credit card application, and they are therefore ultimately responsible for Billy’s debt if he cannot pay it from his allowance. They sit down with him to discuss how to bring his credit card debt into line. It’s not the $2,000 of existing debt that worries them. It’s the continued borrowing, and the expected increased future borrowing once he gets his driver’s license next year. They are worried about Billy’s annual deficits and his growing debt. They track his borrowing with a graph they hang on the refrigerator door.
Billy explains that if they are worried about his borrowing, the answer is simple: increase his allowance. That can reduce or even eliminate his future deficits. Next year his parents need to raise his allowance by $2,000 so that his annual credit card borrowing does not increase. It will probably be even more in future years, because he plans to have many friends and drive them many places. Cutting his spending and increasing his allowance will both reduce his future borrowing, and Billy would prefer that his parents increase his allowance because it’s easier and less painful for Billy. This will allow him to keep his longstanding promise to his friends. They’re counting on him.
Billy’s parents realize that Billy’s annual borrowing, his annual deficits and increased credit card debt are not the actual problem to be solved. Billy’s increased borrowing is a symptom of his underlying problem, which is his increased spending. They see why it’s a mistake to focus only on the credit card debt and additional borrowing, because that leads Billy to conclude that allowance increases and spending cuts are equally valid solutions.
A little bit wiser, Billy’s parents now explain that every dollar of additional allowance for Billy means less for the rest of the family. If Billy cuts his spending, his future annual credit card deficits will decline. If Billy’s parents increase his allowance, his credit card deficits will also decline, but the rest of the family (including little Suzy) will suffer. Billy’s parents explain that they care about the promises Billy has made to his friends. They also care about the interests of the rest of the family, and they must balance those competing interests. They tell Billy they are particularly worried about the projected future costs of his promise to drive his friends all over town beginning next year. Maybe he needs to rethink that promise so that he does not make the rest of the Jones family suffer through some combination of higher allowances and credit card debt.
Billy’s problem is not his credit card borrowing. It is not that his allowance is too small. Billy’s problem is his increased spending, now and in the future. That higher spending can be paid either by bigger allowances this year, or by borrowing more using his credit card. Billy’s allowance and his credit card borrowing are the results of his initial decision about how much to spend. Bigger allowances for Billy this year mean less money this year for Mom, Dad, and little Suzy. More credit card debt will require bigger future allowances to pay it off, which will mean less money in the future for Mom, Dad, and Suzy.
Billy’s parents recognize that the combination of an allowance plus an apparently unlimited credit limit lead Billy to make irresponsible spending commitments. They shift their attention and family debate from Billy’s credit card borrowing to his spending habits. They make decisions about how much Billy will be allowed to spend. Once they have decided that, they then allocate that spending between current allowance and credit card borrowing, to determine how much the rest of the family will have available to spend this year, and how much in future years. They still care and are concerned about his annual deficits, and they still track them on the refrigerator door. But they move that graph down to make room for another graph to track Billy’s spending habits. They know that if they get Billy’s spending under control, then the allowances and credit card borrowing will automatically fall into place and the rest of the family’s interests will be protected, now and in the future.
Billy complains about having to cut his spending. Billy’s friends complain even louder, and tell Billy his parents are mean and selfish for forcing him to break a 10 year old promise. And yet as Billy’s parents consider the future of the entire Jones family, they know they are now on track to responsible family finances.
Tomorrow we will look at how Billy is spending his parents’ money and the promises he has made to his friends.
(photo credit: rich kids magazine cover by Dudus Maximus)

Is GDP growth a poor measure of improving living standards?
The Economist is hosting a 10-day debate of the proposition:
This house believes that GDP growth is a poor measure of improving living standards.
Opening statements:
- Defending the motion: Andrew Oswald, Professor of economics, University of Warwick
- Against the motion: Steve Landefeld, Director of the Bureau of Economic Analysis, U.S. Department of Commerce
- Moderator’s opening remarks: Patrick Lane, Deputy Business Affairs Editor, The Economist
Rebuttals:
- Defending the motion: Andrew Oswald
- Against the motion: Steve Landefeld
- Moderator: Patrick Lane
Featured guest: Enrico Giovanni, President, Italian Statistical Office
Featured guest: Michael Boskin, T.M. Friedman Professor of Economics; Senior Fellow, Hoover Institution, Stanford
Featured guest: Me
Closing statements:
- Defending the motion: Andrew Oswald
- Against the motion: Steve Landefeld
- Moderator: Patrick Lane
Thanks to the Economist for including me in the debate.
On day 1 of the debate, 69% of voters agreed with the motion, 31% disagreed. Agree is now up to 72%. I don’t know whether that 70% range is primarily a function of the quality of the arguments or instead of the initial views of those who chose to vote.
Here is my statement.
Gross domestic product is of course an imperfect measure of improving living standards, primarily because it is incomplete. By excluding changes in non-market goods like clean air and water, GDP measures the market value of goods and services produced within a nation, but excludes many important outputs that are not owned, traded, or easily and objectively valued. The “P” stands for product, so GDP is an output measure, whereas living standards are in part a function of the goods and services we consume and of the income generated by those we produce.
GDP does not measure happiness, or well-being, or what economists call utility. As a gross measure, it aggregates data for a geographic area, ignoring important distributional questions and individual preferences. As a flow measure, it does not account for the value of a nation’s stock of assets and liabilities.
Andrew Oswald argues: “GDP is too narrow a measure of the things that truly matter to humans to be viewed as a valuable indicator in developed nations like ours in 2010.” I shudder to imagine who might assign themselves the role of determining what truly matters to all mankind. Yet the proposition is not whether GDP is a valuable indicator of “things that truly matter to humans”. The proposition is not limited to rich nations or to the present. The proposition is that GDP growth is a poor measure of improving living standards. I oppose that proposition.
Mr Oswald argues that we should measure well-being and include both subjective surveys and sustainability as components of that measurement. I have no quarrel with measuring well-being, but there is no reason to foul up a useful statistic in doing so. GDP is but one indicator that policymakers can and should use to analyse the economic health of a nation, and it is foolish either to use it for a purpose for which it was not intended, or to attempt to change it to suit one’s policy goals. A doctor who monitors only a patient’s pulse is not doing his job, but one who argues we should ask the patient how he feels and call that his “pulse” is outright dangerous.
A patient’s pulse is useful in part because it is an easily measurable and objective metric that is comparable over time and across patients. GDP is quantifiable – it is simply an accounting measure. GDP is objective – we can rely on the data even when personnel in the statistics office change or the party in power flips. GDP is, within limits, roughly comparable across nations and over time, allowing us to make imperfect but still useful policy comparisons and judgments. And since wealthier societies generally devote some of their increased resources to improving non-market attributes like clean air and water, GDP is only partially incomplete as a measure of the non-tradable aspects of improved living standards.
I would rather live in the Turks and Caicos Islands than in Iran, even though the latter has a higher per person GDP. But if you ask me in which of two unlabelled countries I want to live, and if I know only their per person GDP, I will choose the higher one because it probably has a higher standard of living. Similarly, if you tell me only that a country’s GDP has grown 10% and ask me if the standard of living has improved, I will almost always be right if I guess that it has. Higher GDP means more tradable resources for individuals and governments with which to improve standards of living. Economic growth is good, and more economic growth is better. Ask a family in a poor African nation whether they agree with Mr Oswald’s conclusion that man needs “to make fewer things rather than more”, and whether they need to value tranquil beauty more and a car less.
Money cannot buy happiness, and GDP cannot measure it. But as a measure of improving living standards, it is both adequate and superior to subjectively defined, internationally incomparable and time-inconsistent measures of happiness based on someone’s subjective decision about how you should measure your happiness.
(photo credit: JoA in an argument by Anders V)

How should we define Too Big to Fail?
I’d like to propose some structure to the policy debate around the Too Big to Fail (TBTF) concept. This arises mostly from my frustration with both the debate among policymakers and the press coverage of that debate. Many people seem to be talking past each other.
The following explanation will be too elementary for some, but I find I often benefit from getting my problem definition straight before trying to debate solutions. My thoughts on this topic continue to evolve, so I invite readers with expertise to help me improve the following. I’m thinking of this both in the context of the current legislative debate, as well as to help my work as a member of the Financial Crisis Inquiry Commission.
Too Big to Fail is catchy but imprecise. I’d like to incrementally build a more complex but more precise problem definition.
Original problem definition:
Financial firm X is too big to fail.
Some misinterpret this as meaning that really big financial firms cannot fail. Of course we have seen large financial firms collapse, so we know they can fail. Our policy problem is instead that policymakers are unwilling to allow financial firm X to fail, because firm failure could cause damage to something else valued by those policymakers. This leads me to …
Revision 1:
Financial firm X is too big for policymakers to be willing to allow it to fail, because they fear that failure could have severe negative consequences for the broader financial system, economy, or society.
Severity is a key concept in Revision 1. When a factory shuts down, the town hosting that factory may vanish. While policymakers hate it when factories close and towns vanish, they generally don’t intervene to prevent this bad thing from happening. It’s the painful but necessary result of a market-based economy. In TBTF, we should only be willing to intervene if firm X’s failure would have negative effects beyond the scope of the firm that far exceed a town vanishing (which is pretty darn severe).
The other key concept is risk aversion. I know some conservatives (including some in positions of power in Congress) who argue that the Fed and Bush Administration should have just sat tight and let market forces act on Bear Stearns, Merrill Lynch, AIG, Citigroup, Fannie Mae, Freddie Mac, and others. Whether or not you agree with this view, it won’t happen. Imagine you are the Treasury Secretary, and your staff tells you that by letting firm X fail you risk a 10% chance of a catastrophic market collapse. No one who would be chosen and confirmed as Treasury Secretary would be willing to take that chance. Thus you don’t need to know that firm X’s failure will lead to a market collapse, only that there’s a big enough chance that it could lead to a market collapse.
If you stand up one giant-sized domino far from other standing dominoes, you don’t worry too much about it falling over.
If you stand up one giant-sized domino near a bunch of other dominoes, then you worry a lot about the giant one falling over because it may start a chain reaction. The failure of a hypothetical enormous financial firm that is isolated and has no ties to other firms doesn’t concern us (imagine it just buys and sells stocks on the NYSE). It’s the financial interconnections between a big financial firm and other firms that cause us to worry, because the big firm’s failure may cause other interconnected firms to fail. This leads us to …
Revision 2:
Financial firm X is too big and interconnected to other financial firms for policymakers to be willing to allow it to fail, because they fear that failure could have severe negative consequences for the broader financial system, economy, or society.
Now what do we mean by interconnected? And while we’re at it, what do we mean by fail?
I think people use fail to mean different things. Does fail mean a firm is illiquid, in which it lacks the cash to pay tomorrow’s bills and creditors?
Does fail mean a firm is insolvent, in which its assets are less than its liabilities?
Does fail mean a firm has filed for bankruptcy, which could lead to firm survival through a restructuring, a merger, or a sale, or instead to the firm being liquidated and ceasing existence?
What is the policy problem we’re trying to solve?
In the case of a commercial bank it’s easy: we worry that bankruptcy means depositors would lose some of their money. This is why we have deposit insurance, so that if a commercial bank fails, depositors have protection for their deposits (up to a limit). This prevents depositors from initiating a run on the bank when the bank is rumored to be at risk of insolvency. They don’t worry because their deposits are insured.
Since depositors are covered, I think the core unsolved policy problem is counterparty risk. If financial firm Y loans financial firm X a lot of money, then X and Y are counterparties. If X fails, then X’s inability to repay Y may cause Y to fail. Y may have to sell some of its assets quickly to generate cash to fill the hole left by X, and this fire sale may further weaken firm Y.
The clearest trigger for firm X not repaying its obligation to firm Y is bankruptcy. This is why (I think) policymakers believe they must take extreme measures to prevent firm X from going bankrupt. Bankruptcy triggers the counterparty problem.
Some mistakenly conclude that policymakers are trying to protect the equity shareholders of firm X. I have yet to meet a policymaker who is trying to do this. Everyone has the same reaction: equity shareholders gambled, and they lost. Tough luck for them. Unfortunately, the solutions implemented so far allow the shareholders to benefit. I think this is an unintended and undesirable side effect of the solutions implemented so far.
I think what matters is “How big of a counterparty is the failing firm X to firm Y?” What matters is the size of the unpaid loan relative to the portfolio of the lender, not the borrower. (Counterparties often involve financial relationships that are much more complex than a simple loan, but if we figure it out for a loan, I think it’s easily extensible to other counterparty transactions.)
One consequence is that the corporate form and the nature of the business of firm X are irrelevant. If X is a commercial bank, an investment bank, a hedge fund, a pension fund, or even a university endowment, the same logic applies. The only thing that matters in this problem definition is how large of a counterparty X is to other financial firms. Another consequence is that we also don’t care what caused firm X to fail, only that it cannot repay a big loan to firm Y, and that we’re worried about a potential cascade of dominoes. If I’m right on these points, it will significantly affect how we think about possible solutions.
Example: A kid owes you $10. Donald Trump owes you $100,000. If the kid goes bankrupt, you don’t worry too much, even if the kid started out with only $11 of assets and liabilities. If Trump goes bankrupt and can only pay you $5,000 of the $100,000 he owes you, the $95,000 loss may force you into bankruptcy, even though the $100,000 obligation was only a small fraction of Trump’s balance sheet. And you don’t care what business he was in, or whether he lost his money investing in real estate or gambling in Atlantic City. You care only that he’s not going to repay you in full and on time.
The interconnectedness between firms X and Y also depends on how highly leveraged firm Y is, for two reasons:
- The more highly leveraged is firm Y, the smaller of an equity cushion it has to absorb losses.
- Highly leveraged firms generally increase their leverage not through simple loans or bonds, but instead through more complex transactions like collateralized loans and “repurchase agreements.” More complex transactions means more counterparties, more dominoes nearby that you could knock your firm over when they fall.
Bankruptcy means that some creditors won’t be fully repaid. That’s why policymakers draw the line there, and it’s why in Revision 3 I’m going to substitute go bankrupt for fail.
Revision 3:
Financial firm X is too big and interconnected to other financial firms for policymakers to be willing to allow it to go bankrupt, because if X is a big counterparty to other firms, X’s bankruptcy might cause those other firms to go bankrupt, starting a chain reaction.
Finally, I think we need to distinguish between a solvency crisis and a liquidity crisis. A solvency crisis is when your net worth is negative. A liquidity crisis is when your net worth is positive but you lack the cash to pay today’s bills.
A confidence crisis can lead to a liquidity crisis. Imagine if firm Z has given firm X a rolling one week $100 M loan and renewed that loan every Wednesday for the past year. Assume firm X is solvent with a strong balance sheet, but that it relies on that short-term loan to stay cash-positive each week. If firm Z loses confidence in firm X and refuses to renew that loan, then firm X could face a liquidity crisis until it can find another source for short-term cash. Firm Z may be relying on good information, bad information, or rumors. Either way, X’s short term financing dries up, especially if other potential sources of short-term cash make the same decision as firm Z. (A critical question: why does firm X’s management risk its existence on such an ephemeral source of short-term financing?)
A liquidity crisis can lead to a solvency crisis. If you are desperate for cash to pay today’s bills, you can sell some of your assets at fire sale prices to raise the cash. But this weakens your balance sheet. If you lack cash tomorrow as well, your balance sheet will get worse each day as you sell assets on the cheap to pay each day’s bills. Eventually your short-term solution to your liquidity crisis can cause your net worth to go negative, in which case you’re now insolvent.
In 2008 we worried mostly about “disorderly failure.” Suppose firm X loaned $100 M to firm Y for one week every Tuesday for the past year, and suppose firm Z loaned firm Y $100 M for one week each Wednesday. Suppose you know that firm Y has a strong balance sheet, but that it needs these two $100 M short-term loans each week to remain liquid.
Suppose firm X suddenly goes bankrupt on a Monday. As a result, it cannot loan firm Y $100 M on Tuesday. Firm Z knows that firm Y is strong, but fears Y may now face a liquidity crisis. Is firm Z willing to loan firm Y $100 M on Wednesday? Firm X’s failure, combined with firm Z’s decision, can trigger a liquidity crisis at firm Y.
Y’s problem is not simply the failure of X, because Y can find another short-term lender, given enough time. Y’s problem is the sudden and disorderly failure of X, one of its big counterparties. If Y has either time to prepare for X’s failure, or sufficient time after X’s collapse to fix its problem by finding another lender, then Y will be fine.
So our final revision narrows the problem definition a bit:
Revision 4:
Financial firm X is too big and interconnected to other financial firms for policymakers to be willing to allow it to go bankrupt in a sudden and disorderly fashion, because if X is a big counterparty to other firms, X’s sudden and disorderly bankruptcy might cause those other firms to lose liquidity and go bankrupt, starting a chain reaction.
Example: In March 2008, Bear Stearns ultimately ceased to exist as a free-standing entity, despite a loan (“bailout”) from the Fed. The Fed loan bought time for Bear’s failure to result in a purchase by another firm (JP Morgan). The Fed loan was not to save Bear, it was to buy sufficient time and to facilitate (subsidize) the JP Morgan transaction, so that the failure didn’t risk causing a cascading series of failures.
I invite comments, especially those suggesting specific language improvements to this problem definition. I will turn next to looking at the classes of solutions being proposed.
(photo credit: Domino Theory At Work by r o s e n d a h l)

Why do so many Americans pay no income taxes?
Today many are discussing how many Americans do not owe income taxes. The traditional debate splits along partisan lines. Many Republicans and conservatives argue it is both unfair and politically dangerous to have (almost half / more than one-third, depending on who’s measuring) of Americans not owing any income taxes. Many Democrats argue the rich should pay more, and that it’s good that low and even moderate-income people owe no income taxes.
I wonder how many Republican Members of Congress remember that they are, in large part, responsible for this outcome?
First, here’s a quick refresher on the difference between a tax deduction and a tax credit:
- Suppose you make $60,000 per year. If you donate $5,000 to charity, you get a $5,000 deduction. You pay income taxes on only $55,000.
- Suppose a married couple finds they owe $12,000 in income taxes before accounting for the child credit. If they have three kids, they get a $1,000 tax credit for each child, for a total of $3,000 in tax credits. They subtract this $3,000 from their $12,000 of income taxes owed, leaving them owing $9,000 after accounting for the child tax credit.
- Suppose this same family owed only $2,500 in income taxes before accounting for their three children and the child tax credit. Since the child tax credit is refundable, the $3,000 credit wipes out all of their $2,500 of income tax liability and they get $500 from Uncle Sam.
The reason so many Americans don’t owe income taxes is because we have two big tax credits in the code: the Earned Income Tax Credit (EITC) and the child tax credit. I hope the above explanation shows the power of a tax credit: one dollar of tax credit wipes out one dollar of tax liability. So if you provide a big tax credit to someone who owes only a small amount of income taxes, you’re probably going to move them into the non-payer category.
The EITC benefits low-wage earners. Legislative support often splits roughly along party lines, with most Democrats wanting a bigger EITC, and many Republicans wanting a smaller (or, at least, no bigger) EITC. Republicans like to complain about the EITC on a day like today.
But most of the increase since the mid-1990s in the number of people who owe no income taxes is the result of the child tax credit. This policy was created by Congressional Republicans and expanded with Republicans in the lead.
The nonpartisan Tax Foundation has measured the top nonpayer threshold. This is the highest income taxpayer that owes no income taxes, setting aside unusual tax situations. They looked at how the top nonpayer threshold changed from 1993 to today for a married couple with two kids. All figures are in 2010 dollars for comparison:
- In 1997 every “normal” married couple with two children that earned $24,000 or more (in today’s dollars) had to pay at least some income taxes. The top nonpayer threshold for a family of this size was just under $24,000. This means there were some four-person families with income just below $24,000 that owed no income taxes.
- In 1997 a Republican majority Congress and President Clinton enacted the Balanced Budget Act. At the insistence of Congressional Republicans, this law created a $400-per-child tax credit which began in 1998. This caused the top nonpayer threshold to jump more than $7,000, to about $31,300. Millions of families with kids with incomes between $24,000 and $31,300 were “taken off the rolls” because the child tax credit wiped out the small income tax liability they owed.
- As a result of the 1997 law, in 1999 the child tax credit automatically increased to $500 per child, and the threshold for a married family with two kids grew to $32,800 in today’s dollars.
- In 2001 President Bush and the Republican Congress enacted a major tax law that increased the child tax credit to $600. This law also introduced the 10% income tax bracket, which lowered by 5 percentage points the lowest income tax rate. The combination of these two tax changes raised the top nonpayer threshold to $38,700. That law further phased in over time increases in the child credit to $1,000 per child.
- The 2003 tax law enacted by President Bush and the Republican Congress accelerated the $1,000 per child amount to be effective immediately. This increased the threshold to $47,400 in 2003. That’s a huge jump. It was incredibly popular, and it helped create political impetus for the 2003 law which also accelerated rate reductions and cut capital gains and dividend rates.
- The 2008 stimulus (President Bush + Democratic majority Congress) included stimulus checks of $1,200 per married couple, plus another $300 per child. This increased the threshold to $56,700. This was a one-time increase, however, and the non-stimulus threshold for 2008 was about $44,500.
- In 2009 President Obama and a Democratic majority Congress increased this threshold to $51,400 with the new “making-work-pay” tax credit. This was enacted on near party-line votes. That threshold drops slightly to about $50,300 this year.
What can we conclude from this?
- The huge number of Americans who owe no income taxes is the result of the interaction of three tax policies:
- a progressive rate structure and a standard deduction;
- the Earned Income Tax Credit, which significantly reduces tax liability for the lowest earners;
- the per-child tax credit, which significantly reduces tax liability for low- and moderate-income families with kids.
- Different political coalitions support these three policies:
- There is broad-based political support spanning both parties for a progressive rate structure. Republicans split on this point, with some conservatives favoring a flat tax. Even many flat tax supporters support some progressivity with a large(r) standard deduction.
- Support for expanding/keeping EITC tends to be center-left. Many on the right oppose it at its current size.
- Support for the per-child tax credit is nearly universal, but it started on the right.
- The large number of people who owed no income taxes until the mid-90s was driven largely by the first two factors and especially by the Earned Income Tax Credit, a policy driven by the Left.
- The dramatic increase in the number of people who owed no income taxes since the mid-90s was driven almost entirely by the creation and expansion of the per-child tax credit, a policy driven by the Right.
- This was a “pro-family” tax credit created in the 1994 Contract with America, pushed to a veto by Congressional Republicans in 1995, negotiated with President Clinton in 1997, and expanded by President Bush and Republicans.
Behind closed doors Republicans split on the per-child tax credit. Economic types oppose it or hold their noses. Social/family conservatives vigorously support it, as does almost anyone running for office.
It’s easy for Republicans to complain today about the end result. They (we) have an out in that they can point to the EITC as one of the causes. But much of this outcome is driven by tax policy changes initiated and expanded by Republicans.
If you wanted to work within the current income tax system and reverse some of this trend, broadening the income-taxpaying base, you’d be hard pressed to get a big effect just by raising the bottom rates. To affect millions of people you’d need to either scale back EITC or the per-child tax credit. I think both are highly unlikely.
(photo credit: hope and megan)
Should taxpayers subsidize underwater homeowners?
This is shocking:
The Obama administration will announce a major new stock market initiative on Friday that will directly tackle the problem of the millions of Americans who lost money betting on stocks. The government will buy loans from stock brokerage houses at the current value of the stocks in an investor’s portfolio, in an effort to stabilize the stock market, people briefed on the plan said. The government will also increase incentive payments to stock brokers who loaned on margin to their investing clients and now assume some of the losses of those clients. And it will require those stock brokers to cover some of the losses of unemployed investors for a minimum of three months.
OK, I made that up. But how is it different from this, which is real?
The Obama administration will announce a major new housing initiative on Friday that will directly tackle the problem of the millions of Americans who owe more on their houses than they are worth. The government will buy loans from investors at the current value of the house in an effort to stabilize the market, people briefed on the plan said. The government will also increase incentive payments to lenders that cut the principal of borrowers in modification programs. And it will require lenders to cut the monthly payments of unemployed borrowers for a minimum of three months.
The Administration is using tax dollars to subsidize some homeowners who are underwater on their mortgages. Today they are beefing up two housing programs with more money.
These programs are targeted at homeowners who could almost but not quite afford their mortgage. The idea is that, with some taxpayer subsidy, their lender will agree to reduce or delay some mortgage payments.
Who is eligible? Under one program, called HAMP, the Home Affordable Modification Program, you are eligible if you:
… live in an owner occupied principal residence, have a mortgage balance less than $729,750, owe monthly mortgage payments that are not affordable (greater than 31 percent of their income) and demonstrate a financial hardship. The new flexibilities for the modification initiative announced today continue to target this group of homeowners.
Excuse me? We’re going to subsidize someone with a mortgage balance of $700,000?!
(Updated: A knowledgeable reader thinks my 5.25% interest rate was unreasonably low, so I’m changing the example to assume a 7% rate.)
Let’s do a quick back-of-the-envelope calculation. Suppose you have a mortgage balance of $700K, with 28 years left on your 30-year mortgage at a fixed 7% 5.25% . Your monthly mortgage payments would be almost $4,800. If that’s greater than 31% of your income, you make less than $186,000 per year.
Does it really make sense for the Administration to use taxpayer funds to subsidize someone making less than $186,000 per year to stay in a home with a $700,000 mortgage balance?!
We further learn the Administration intends to spend $50 B of TARP money for these initiatives.
The Administration argues their goal “is to promote stability for both the housing market and homeowners.” Stability sounds good. The risk is that instead of solving the foreclosure problem, these policies may just prolong it. (The same could be said of some housing initiatives we did in the Bush Administration.) A core housing policy question is whether it’s better in the long run to buy time for struggling homeowners in the hope that they and the housing market will eventually recover, or instead to just rip off the band aid as quickly as possible. Allow the housing market to adjust quickly by not trying to create artificial “stability” above a market-clearing price. Such an adjustment would be excruciating in the short run, and painful for many who would lose their homes. But like ripping off a band aid, it would get all the pain behind us, so that things could return to a normal and more stable growth pattern going forward. I don’t have the answer to this question, but I do get nervous with those who confidently assert that they can create stability, and that they know the right price at which stability should be maintained. Every little kid knows there’s less total pain if you rip off a band-aid quickly. The same may be true here.
Buying a house is a big deal. So is getting a mortgage. As with any investment, when you buy a house and a mortgage you assume both upside and downside risk. You are responsible for both sides of that bet, not someone else.
Some homeowners were fooled or deceived into buying a bad adjustable rate mortgage (ARM). I feel bad for them and am willing to consider policies directed at them. At the same time, it’s hard to distinguish “fooled or deceived” ARM buyers from “savvy speculator” ARM buyers, so if we subsidize one we may end up subsidizing the other as well.
But now let’s look at a homeowner with a fixed rate mortgage who is “underwater” because his home has declined in value so that the house is worth less than the mortgage. His net worth has declined because the value of his home plummeted, and that’s tragic. But since he has a fixed rate mortgage, his monthly mortgage payment has not changed. The decline in the value of their home has not affected his ability to make his mortgage payment, and therefore to remain in that home.
He can continue to live in his home and wait for the value to appreciate, just as a stockholder can hold onto a stock after a decline and wait for the price to recover. I don’t see why taxpayers should subsidize him because he lost money on an investment, just as taxpayers shouldn’t subsidize him if he lost money in the stock market.
This homeowner may face some other financial hardship (see the underlined language above). Maybe he lost his job, or maybe he got hit by a bus and has high medical costs. This financial hardship may cause him to be unable to make his mortgage payments, and with the lost equity value, he cannot borrow against the value of his home. But again, this is no different than if he lost big in the stock market and then lost his job or got hit by a bus.
Imagine twin brothers, each with $180K of annual income. One rents, and the other has a $700,000 mortgage on a home that declined from $800,000 in value to $600,000 in value. Both brothers lose their jobs. Why should the renter pay higher taxes to subsidize his brother’s mortgage payments?
Losing a home due to financial hardship is tragic. Does that make it someone else’s responsibility? Why should a broad-based decline in housing prices shift responsibility for planning for a financial loss from a homeowner to taxpayers? Why do policymakers (on both sides of the aisle) think we should make taxpayers (some of whom struggle to make their own mortgage payments, and others of whom rent housing) subsidize someone who lost money on an investment?
I would like to hear a sound and compassionate policy argument that addresses my twin brother example. To make sure your argument works, please assume there is also a triplet brother who also rents but recently lost $200,000 in the stock market, and explain how your policy applies to him.
My conclusions:
- I would not use tax dollars to subsidize homeowners with fixed rate mortgages. It’s unfair to the taxpayers, those who rent, and those who might want to buy a home. It also slows down painful but inevitable housing market adjustments. I would treat a loss on a home’s value the same way I would treat an investment loss in the stock market. Both are private responsibilities of the investor.
- I would be willing to use some tax dollars to subsidize a subset of those homeowners who were fooled or deceived into buying bad adjustable rate mortgages. I would subsidize only the ones who, with a little taxpayer assistance, could afford to keep their home. The hard part is determining who was fooled or deceived. This subsidy would apply only to bad ARMs made in the past and therefore would not be designed as a permanent program.
- My solution would probably mean more foreclosures in the short run and more rapid housing price declines. I think it would also mean housing markets would adjust more rapidly. My goal would be to allow housing markets to adjust to their market-clearing levels as quickly as possible, based on the logic that this both minimizes total pain and gets it behind us.
- My recommendations would depend heavily on the numbers. Based on the numbers I saw in 2007 and 2008, in all of these policies the taxpayer subsidies per foreclosure avoided are huge. In addition, since it’s hard to distinguish empathetic cases from savvy investors who were placing bets, a significant fraction of the subsidies goes to people whom I believe do not deserve help. Both quantitative factors reinforce the principles that drive my conclusions.
(photo credit: Flood in East End of Cincinnati – 1913 (LOC) by Library of Congress)
What is a vote-a-rama?
I spent 7+ years as a staffer for Senate Budget Committee Chairman Pete Domenici (R-NM) and for Senate Majority (& Minority) Leader Trent Lott (R-MS). One of my few lasting contributions is the term vote-a-rama. I therefore feel obliged to provide a formal definition.
vote-a-rama: (n) an extended sequence of back-to-back votes in the United States Senate. A side effect of special rules for considering the budget resolution or a reconciliation bill, a vote-a-rama may last 10, 20, 30 hours or more, and occurs after all time for debate has expired but before a vote on final passage.
At any point in time, the Senate is debating a question. Some examples include:
- Should the amendment by Senator X be adopted?
- Should the President’s nomination of person Y be approved?
- Should the bill as amended be passed?
Most of these questions are debatable and cannot be “moved.” This means that no one Senator can force a vote on a question until all 100 Senators are done debating. This differs from the House, in which a vote can be forced at a specific time even if some Members object. This apparently minor procedural difference has an enormous impact on the legislative structure of the two bodies.
In practice it means that long periods of time usually elapse between votes. On a typical legislative day Senators might cast only a few votes, spread throughout the day. On a particularly contentious question one or more Senators may engage in extended debate, more commonly known as a filibuster. There is a special procedure to shut off a filibuster called invoking cloture, but until that procedure is completed, no Senate vote may occur for several days.
Each year the House and the Senate must pass a budget resolution that is a quantitative blueprint for the consideration of legislation in that year. A 1974 law sets out special Senate rules for the consideration of a budget resolution. Unlike normal legislation, which can be debated for weeks on end, this law limits the total debate time for a budget resolution to 50 hours.
This same law limits debate time for a reconciliation bill to 20 hours. Debate time for a conference report on a budget resolution or on a reconciliation bill is limited to 10 hours.
While the law limits time for debate on a budget resolution or reconciliation bill, it does not limit time for consideration of either. Consideration = debate + votes. In addition, the Senate cannot vote on final passage of a budget resolution or reconciliation bill until all amendments have been disposed of (basically, voted on).
The interaction of time limited debate, no time limit on consideration, and the requirement that amendments be disposed of before final passage creates an opportunity for Senators. Any Senator can offer one or more amendments to a budget resolution or reconciliation bill and know they will get a quick vote. This is quite different from the process on a normal bill, where you can offer an amendment but not be assured of a quick vote.
As a result, Senators offer lots of amendments to budget resolutions and reconciliation bills. A handful or two of these amendments are debated and voted upon during the 50 or 20 hours of debate, but the rest stack up at the end, after debate time has expired.
And thus was born the vote-a-rama. After 20 hours of debate have expired for a reconciliation bill, all remaining amendments are stacked for back-to-back votes. Unlike normal times, where Senators will come to the floor and hang out for half an hour for two stacked votes, then leave, the vote-a-rama can take 10 hours, 20 hours, or even more.
In theory a normal roll call vote in the Senate lasts 15 minutes. Senators dawdle so it usually takes about 20 minutes. During a vote-a-rama all 100 Senators agree to reduce the time for a vote to 10 minutes, which in practice means 15. This means the Senate can do four votes per hour in the vote-a-rama. As an example, the Senate disposed of nearly 30 amendments and motions yesterday, staying until almost 3 AM. The Senate reconvened at 9:45 AM today and expects the vote-a-rama to continue until about 2 PM. After the final amendment is disposed of, the Senate will vote on final passage of the reconciliation bill.
Usually the Senate agrees to waive the rules precluding debate during the vote-a-rama to allow the sponsor and an opponent of each amendment or motion 30 seconds each (!) to speak before the vote.
The vote-a-rama is an unusual cultural institution within the Senate. All 100 Senators are on the floor, in the cloakrooms, or right outside the Senate Chamber for hours and hours upon end. Another 100-ish staff are packed onto tiny staff benches in the rear of the Chamber, one for Republican staff and another for Democratic staff. Everyone is usually exhausted during the vote-a-rama, which comes near the end of an arduous and usually conflict-ridden legislative battle.
(photo credit: C-SPAN 2 live feed)
A new $29 B gimmick in the reconciliation bill
(Updates and corrections are in green.)
A knowledgeable friend pointed out a $29 B Medicaid gimmick in the reconciliation bill that has so far, to my knowledge, not been publicly discussed.
Both the huge amount of hidden spending and the irresponsible policy should offend responsible policymakers. The reconciliation bill would create a new funding cliff for doctors in Medicaid, parallel to the Medicare doctor funding cliff in current law that fouls Congress up each year. By creating this funding cliff the bill’s authors were able to shave $29 B off the CBO score and once again make the bill appear less expensive than it really is.
In the late 90’s the feds gave up authority to determine Medicaid payments to providers, leaving all that authority in the hands of States. States liked this because they could squeeze payment rates to providers (hospitals, doctors, nursing homes) to save money.
You’ll remember from an earlier post that Medicaid is a shared federal-State financing arrangement. On average the feds pay 57 cents of each dollar spent in a State Medicaid program, and the State covers the other 43 cents. This federal match rate varies by State.
The bill passed by the House last November contained a huge Medicaid win for doctors and their lobby the American Medical Association, although at the expense of federal taxpayers rather than States:
- Through their Medicaid programs, States would be required to pay primary care doctors no less than Medicare pays. In some cases this would significantly increase the amount a doctor received for performing a service in Medicaid. This was a reversal of the late 90s bipartisan policy change giving States complete flexibility to set Medicaid payment rates to providers.
- The federal government would reimburse States for any the increased Medicaid costs that result from this mandated payment rate increase. The federal match rate for the incremental cost would be 100%.
This was a $57 B win (over 10 years) for primary care doctors in the House-passed bill. This is in addition to a much-discussed separate $210 B side deal commitment to the AMA from the White House and Democratic Congressional Leaders to support separate legislation that would prevent Medicare payments to doctors from declining in future years. I will surmise that the $267 B of additional Medicare and Medicaid payments to doctors are the primary reason AMA supported the House-passed bill.
CBO charged the House-passed bill with $57 B of additional spending for this provision.
For reference, the relevant legislative language can be found in §1721 of the House-passed bill (H.R. 3962). The $57 B figure can be found on the line for §1721 on page 7 of the CBO estimate.
Now we have a new reconciliation bill that the Speaker will try to pass on Sunday. §1202 of the new reconciliation bill (p. 60) is identical to §1721 of the House-passed bill except for the dates.
The House-passed bill contains this policy as a permanent windfall for primary care doctors beginning in 2010 (it’s phased in over the first two years).
The reconciliation bill’s authors have limited the House-passed provision so that it applies only for 2013 and 2014.
CBO charged the new reconciliation bill with only $8 B of additional spending, since the provision is in effect for only two years.
For reference, the new legislative language is in §1202 of the reconciliation bill, and the $8.3 B figure is on the line for §1202 on page 10 of the CBO estimate.
The reconciliation bill would therefore create a new Medicaid (not Medicare) “primary care doctor payment cliff,” beginning after 2014. Just as Congress is under unbearable pressure now from doctors to prevent Medicare payments to doctors from being cut, the reconciliation bill would create exactly the same thing in Medicaid, beginning January 1, 2015.
If you assume Congress will not allow that newly created Medicaid funding cliff to bite beginning in 2015, they will spend an additional $29 B in the first decade, beginning in 2015.
This is an intentional gimmick designed to reduce by $29 B the scored cost of the reconciliation bill. As policymakers on both sides of the aisle bemoan the mid-90s Medicare policy change that created today’s Medicare funding cliff, the Speaker and her allies propose to create an exact parallel in Medicaid, beginning Monday.
It’s hard to say which is worse: intentionally hiding $29 B of spending, or intentionally creating a funding cliff. I’ll call it a tie.
(photo credit: bitzcelt)
No new promises, please
This comment is addressed to those fiscally conservative Democratic Members of the House of Representatives thinking of voting for pending health care legislation.
America is on an unsustainable fiscal path. If we do nothing to address this, within 25 years the U.S. government will default on its debt, with devastating consequences for the U.S. economy and society.
We are on this path because past elected officials made unsustainable benefit promises and enshrined them in law. In some cases they paid for those promises in the short run. In all cases they created programs that would grow more generous over time.
Those past elected officials enjoyed the political benefits of creating a new promise, and they shifted the burden of paying for these promises onto their successors and onto future generations of citizens.
You are their successor, and we are those future generations. The bill is coming due. The gap between future spending and taxes is the most important economic problem America faces. If we don’t fix it, we’re screwed.
To fix this problem we need to slow the growth of Social Security, Medicare, and Medicaid spending. You may think we also need to raise taxes, either for reasons of policy or of political compromise.
The long-term fiscal gap is enormous. It’s not measured in billions or even tens of billions of dollars. It’s measured in percentage points of GDP. One percent of GDP this year is $146 billion, and our fiscal gap is many times that. We need to make huge fiscal policy changes to avoid economic disaster.
Big changes are easier to make if we phase them in gradually, so people have time to plan and adjust. The longer we wait to start, the bigger the necessary changes, and the more wrenching they are to American society.
Good policy is to start these changes immediately, so that they’re in place and it’s hard to repeal them. Set the changes up so they grow steadily over time. Turn the aircraft carrier by an enormous amount, begin immediately and do it gradually, but lock the full course and ultimate direction in now. American society can then incrementally adjust to the changing conditions, and elected officials will not be confronted with sudden, disruptive, painful policy spikes they will be tempted to postpone or repeal.
Slowing the growth of popular entitlement programs is politically painful. So is raising taxes. Elected officials get punished for both.
This problem may seem politically intractable because of serious policy disagreements about the relative mix of spending changes and tax increases. Each party sees electoral advantage in attacking the other’s possible proposed solutions, so it’s hard to cooperate across the aisle.
As the pain of a government default approaches, markets will punish the U.S. economy to the point where elected officials will be forced to negotiate a solution. The danger is that you and your colleagues wait until this time, when the changes needed will be bigger and even more painful. If you can fix this before the markets force you to, America will be better off.
You have to fix this because your predecessors made an expensive promise and left you the bill. If you don’t fix it, your successors will have to. After that, the clock runs out and the economy collapses.
Now President Obama and your party’s Congressional leaders want to make a new promise. They want to expand the role of government so that almost every American has prepaid health insurance. Like past promises, this is attractive to the millions who would receive the benefits of this new promise, and to many more who feel compassion for them. Like many, you probably believe that reducing the number of uninsured is an important policy goal.
What about the costs of funding this new promise? In this legislation President Obama and your party’s Congressional leaders have made some hard choices. The biggest are policies that would slow the growth of Medicare spending and policies that would raise certain taxes. These are hard policy choices that involve societal pain and political risk.
The legislation has been structured so that, if it is never changed, and if the projections hold true, the costs of this new promise will be fully offset by the Medicare “cuts” and tax increases. The costs of the new promises will not be shifted to the future if those two conditions hold. The referee says that, if those two conditions hold, this new promise has been paid for.
That makes this bill different than some of its predecessors. The President argues that it is more responsible than past promises. He argues further that it is fiscally responsible. I agree with the first and disagree with the second.
If these bills become law, we are left with two problems. The assumed conditions may not hold, so this new promise may in fact be underfunded just like all prior promises. And even if the conditions hold, we still have left unsolved the long-term fiscal problem with which we began, and we have fewer tools available to fix it.
The assumed conditions will not hold because they are not designed to hold. The bills’ authors have cleverly constructed the promises so that they are paid for in an accounting sense, but are politically unsustainable. New Medicare spending on doctors is paid for, as long as you believe Congress will allow even bigger cuts to take effect two years from now. The new insurance subsidies are paid for, as long as you believe that a tax increase scheduled to begin far in the future will survive eight years of labor union lobbying for repeal or perpetual delay. The new insurance subsidies are designed to cover those who buy health insurance outside of employment, but not those with the same salary who get health insurance through their job. If you believe this inequity is politically sustainable, then the bill is paid for. If instead you think there will be unbearable political pressure to provide equal treatment and expand subsidies to some of the 100+ million Americans who today get their health insurance through their job, then the subsidies you enact now are only the camel’s nose under the tent, and you are setting us on a path to an even larger and unfunded government promise.
The bill’s architects have cleverly gamed the rules to minimally satisfy the requirements of getting the referee to say the new promise is funded, while creating real long-term fiscal risk. There is an obvious parallel to the financial engineers who worked with credit rating agencies to tweak new risky credit derivatives until they barely qualified for a AAA rating. The financial engineers did not eliminate real risk, they instead solved for the rating agency’s scoring model. They then sold these products to clients as safe investments, with a wink. The authors of the pending health care bills have done the same with the CBO scorekeepers. You are the potential client being asked to buy this product. The proponents assure you that the scorekeeper says it’s OK. Then they wink.
Like many clients who did not understand the derivatives they were buying, you may not be an expert in the arcane world of CBO scoring. Or you may believe the bill will be implemented exactly as written, that there will be no future expansions or spending increases, and that future elected officials will resist all of the above pressures. If so, you still must wrestle with the unsustainable fiscal path with which we began. The deficit reduction credited to this bill by the referee and claimed by the bills’ proponents sounds large, but compared to our long-term fiscal problems it is trivially small. The President argued that health reform is entitlement reform, and that slowing the growth of health spending would address our long-term fiscal problem.
Instead, at best this bill makes our long-term fiscal problem no worse, while using up options to solve it. The pending legislation takes all of the easiest hard choices and uses them to offset the new promise. This leaves even harder and more painful policy choices when policymakers choose or are forced to address the long-term fiscal problem.
The pending legislation raises taxes “on the rich.” When someone tries to close our long-term fiscal gap, these tax increases will no longer be available.
The pending legislation slows the growth of Medicare spending, but then spends that money on the new promise. We still have the old unfunded promises, and those relatively easy Medicare policy changes will no longer be available to fund them.
When you or your successors choose or are forced to solve our long-term fiscal problem, these tools will be unavailable. You will have to reduce benefits and charge seniors higher premiums, copayments, and deductibles. You will have to cut provider payments even more. You will have to means-test benefits more aggressively. You will have to raise the eligibility age for these programs. If you favor tax increases, you will find yourself evaluating options to raise them not just on the rich, but also on the middle class. The arithmetic will force you to do these things.
You will have to do some of these things even if the pending health care bills die. You will have to do many more of them if these health care bills become law.
You are being pushed to do a variant of what your predecessors have done. Solve a societal problem. Make a popular new promise. Ignore those who warn the promise is underfunded. Worry about the existing long-term problem later, or better yet, hand it off to the next crowd. If this legislation makes that long-term problem harder to solve by taking future options off the table, someone else can worry about that.
There is a simple answer, and you can choose it. Break the cycle. Don’t make a new promise that makes our biggest problem harder to solve and pushes it into the future. On our current path there’s not much future left.
Make us no new promises, please, until you have funded the old ones.
(photo credit: epSos.de)
Understanding the new health reconciliation bill
Congressional Democratic leaders just released their summary of Bill #2, the health bill they intend to move through the reconciliation process.
Here is their description document. I caution you that this is a sales pitch aimed at Congressional Democrats.
Here is the preliminary CBO analysis.
Here is the legislative text, on which I am just now about to begin chewing.
Since things are moving quickly, I’m going to repeatedly update this post. You might want to bookmark it and return for updates.
The following notes are fairly technical. Most will be interesting only to policy practitioners.
Preliminary, technical, and disorganized very rough notes on the outline
<
ul>