In a letter to four key Republican Congressmen (Camp, Barton, Kline, and Ryan), the Congressional Budget Office destroys the House Democrats’ implementation of the President’s goal of long-term fiscal responsibility through health care reform. With this analysis the fight about the House bill is over by a technical knockout (TKO). The proposed income tax increases were the key vulnerability. I will walk you through the analysis and why I reach the following conclusion.
Conclusion: CBO says that because the proposed new health spending would grow faster than the proposed new income tax increases, the House health bill would increase the long-term deficit. Since the President has said he would not sign a bill that increases the long-term deficit, the bill is dead in its current form. Any tax increase that would grow more slowly than the proposed new spending faces the same irreconcilable problem. The only way to solve this problem and meet the President’s long-term goal is to cut health spending or tax employer-provided health insurance.
We can start by looking at the short-term budget effects of the House Tri-Committee health bill over the next ten years:
|
10-year deficit effect |
|
| New coverage provisions |
+ $1,042 billion |
| Medicare savings |
– $219 billion |
| Other provisions (primarily income tax increases) |
– $583 billion |
| Net deficit increases |
+ $239 billion |
The new CBO information is about the long run deficit. Here is the key paragraph from the 18 page CBO letter:
Looking ahead to the decade beyond 2019, CBO tries to evaluate the rate at which the budgetary impact of each of those broad categories would be likely to change over time. The net cost of the coverage provisions would be growing at a rate of more than 8 percent per year in nominal terms between 2017 and 2019; we would anticipate a similar trend in the subsequent decade. The reductions in direct spending would also be larger in the second decade than in the first, and they would represent an increasing share of spending on Medicare over that period; however, they would be much smaller at the end of the 10-year budget window than the cost of the coverage provisions, so they would not be likely to keep pace in dollar terms with the rising cost of the coverage expansion. Revenue from the surcharge on high-income individuals would be growing at about 5 percent per year in nominal terms between 2017 and 2019; that component would continue to grow at a slower rate than the cost of the coverage expansion in the following decade. In sum, relative to current law, the proposal would probably generate substantial increases in federal budget deficits during the decade beyond the current 10-year budget window.
In the long run, it’s all about growth rates. Let’s go to the chalkboard. All numbers are from CBO’s July 14th estimate of the House bill, Joint Tax Committee’s July 16th estimate, and CBO’s July 26th letter to Mr. Camp.
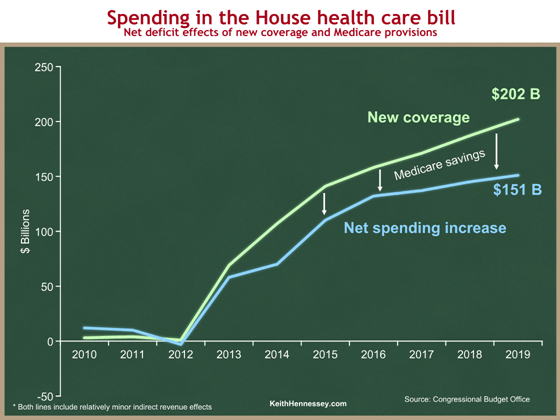
We start with the short run, and look just at the new coverage provisions in green, and the net spending increase in blue. Proposed Medicare savings bring the gross new coverage spending of the green line down to the net spending increase of the blue line. As always, you can click on any graph to see a larger version.
Spending would start in 2013 and ramp up to its long-term path by 2015. In 2019 the bill spends $202 B on the new coverage provisions and saves $51 B from Medicare, for a net spending increase of $151 B.
A small caveat: both the new coverage section of the CBO estimate and the Medicare savings include some indirect revenue effects, such as the higher taxes that would be collected from individuals and employers who don’t comply with the mandates. So technically these lines show the net deficit effects of the “New coverage” and Medicare sections of the bill. The revenue components are relatively small, and this oversimplification does not affect the analysis, so I’m labeling the blue line “net spending increase.” In addition, this is how CBO packages things, so I am confident it’s a safe oversimplification.
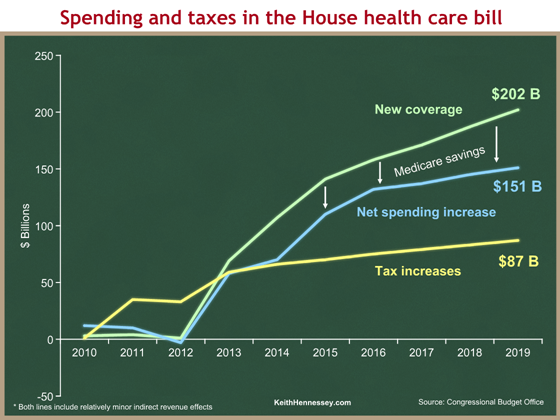
Now let’s add to the graph the tax increases in the House bill as a new yellow line. Everything else is the same as on the first graph.
The House bill raises $87 B of taxes in 2019, compared to the $151 B net spending increase in that year. The area between the light blue and yellow lines is the deficit impact. Up to 2013, the bill collects more in taxes than it spends, so the bill actually reduces budget deficits in the early years. After 2013, the light blue net spending line is above the yellow tax line, so the bill adds to the deficit. In 2019, the bill increases the deficit by $151 B – $87 B = $64 B. The net of the deficit-reducing and deficit-increasing areas is the $239 B deficit increase over 10 years from the first table above. Again, all of these are CBO and Joint Tax Committee numbers.
Now we turn to the long run, relying on that key CBO paragraph. Here are the key numbers:
The net cost of the coverage provisions would be growing at a rate of more than 8 percent per year in nominal terms between 2017 and 2019; we would anticipate a similar trend in the subsequent decade. … Revenue from the surcharge on high-income individuals would be growing at about 5 percent per year in nominal terms between 2017 and 2019; that component would continue to grow at a slower rate than the cost of the coverage expansion in the following decade.
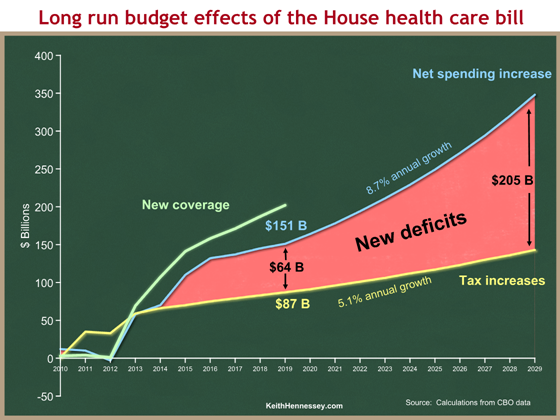
CBO phrases this a little bit carefully, so I want to be clear that this last graph represents my interpretation of the above language, rather than explicit calculations provided by CBO. I’m going to extend the blue and yellow lines from the graph above through the second decade.
Here are some details for the technicians:
- All figures through 2019 are from CBO’s July 14th estimate and Joint Tax’s July 16th estimate.
- The average annual growth rate of the yellow line from 2017 to 2019 is 5.1%, derived from the JCT July 16th estimate.
- Beyond 2019, the yellow line is the 2019 figure of $87 B from Joint Tax, grown at a 5.1% annual rate.
- The average annual growth rate of the blue line from 2017 to 2019 is 8.7%, derived from the CBO July 14th estimate.
- Beyond 2019, the blue line is the 2019 figure of $151 B, grown at an 8.7% annual rate.
- The $205 B deficit increase in 2029 is simply the delta between the two calculated points for that date.
I am being a little more precise than CBO’s language. They were careful not to explicitly say that the growth rates would be precisely 8.7% and 5.1% over the next decade, but it’s the most reasonable conclusion from their language if you have to pick numbers. It’s not fair to say that the $205 B figure is a CBO number — it’s not. It is fair to say that the ever-widening red area, representing large and increasing long-term deficit increases, represents CBO’s conclusion.
What does this mean?
This is the most important analysis CBO has done of the House health bill.
Remember the President’s three part test:
- A bill should not increase the budget deficit in the short run (the first ten years).
- A bill should not increase the budget deficit in the tenth year.
- A bill should “bend the health cost curve down” in the long run. (More recently, a weaker test that a bill must not increase long-term deficits.)
I would prefer stronger tests, which I proposed six weeks ago.
The second graph demonstrates that the House bill would fail the first two tests. CBO and Joint Tax said that in their July 14th and July 16th estimates. The House bill increases deficits by $239 B over the next decade, and by $64 B in the tenth year.
The new information is CBO’s conclusion that the House bill would increase long-term budget deficits, because the new spending will grow faster than the income tax increases. This is logical: if the net spending increases start the second decade $64 B higher than the tax increases, and if the spending will grow 8.7% per year while the taxes will grow only 5.1% per year, then the gap between the two, the budget deficit, will only grow over time. CBO has concluded that the House bill would make America’s long-term deficit problem dramatically worse than it is under current law. This clearly fails the third Presidential test.
There’s another conclusion that is implicit in CBO’s analysis. Because of the different growth rates, there is no way to solve this problem by raising income taxes like the House bill does. If you want to include tax increases in your bill, they have to match the net spending increase in the tenth year, and they have to grow at least as fast as the 8.7% growth rate of long-term net spending. The only thing that has a chance of doing that is the taxation of health benefits.
I think this is fatal to the House bill. The income tax increases were already in serious trouble because of opposition from Blue Dog Democrats who do not want to raise taxes on small business owners, and who do not want to be BTU’d (again) by Senate Democrats who have said they won’t raise income taxes. But House Democratic Leaders were relying on these tax increases to avoid having to make deeper entitlement spending cuts, tax employer-provided health insurance, or dramatically scale back their proposed new spending. CBO has called the fight over by a technical knockout.
Where have I heard this before?
If you are patient enough to have read this blog over the past few months, some of this may look familiar to you. Here’s what I wrote on June 12:
It is therefore odd and self-contradictory that they have proposed raising taxes to offset the higher spending of a new health care entitlement for the uninsured. While you can technically meet my short-term Test 1 by doing so (in a Blue Dog / centrist way that I would oppose, but you’d meet it), it is mathematically impossible in the long run to offset a new health care entitlement with higher taxes, unless your bill also slows the growth of health care spending in other ways.


