Almost two months ago, President Obama set a specific employment goal for his Administration:
I think my initial measure of success is creating or saving 4 million jobs.
It is clear that this “create or save” phrase is now a standard and important part of the Administration’s economic message.
Greg Mankiw quickly identified both the quantitative ambiguity and political creativity in defining the goal in this way. Now that we have a couple of months of data, I’d like to reprise Greg’s post with a concrete example of why this is a misleading metric that is vulnerable to manipulation.
The Bureau of Labor Statistics reported the following on Friday:
| Nonfarm employment level, January 2009 | 134,333,000 |
| … plus change in February | -653,000 |
| … plus change in March | -661,000 |
| … equals nonfarm employment level, March 2009 | 133,019,000 |
| Net change in Obama Administration | -1,314,000 |
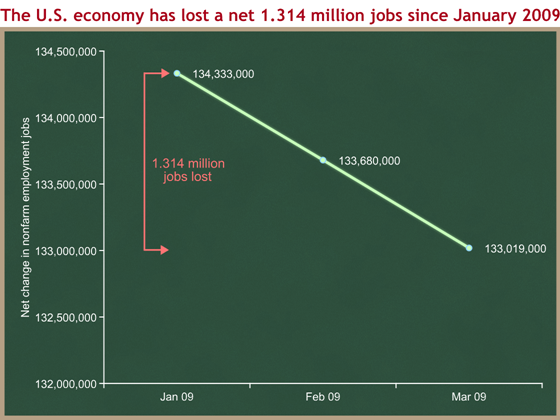
You can see that the U.S. economy has lost a net 1.314 million jobs since January. Let’s look at it graphically:
The traditional way to measure jobs “created” or “lost” is by taking the change between the starting point and the ending point of your timeframe. I have displayed this in red on the graph. Administrations are always judged (at least by the press) based on the change in the level of employment from January 20th in their first year to the current level.
I think the traditional way is a poor metric because political and business cycles don’t line up. I will expand on this further in a separate post about starting points, and whether it’s fair to assign blame or credit to the Obama Administration for jobs lost in the first two months of their Administration.(Hint: It’s not, but it is always done so they are stuck with it.) For now I want to focus on the “or saved” point. We start with the factual statement that the U.S. economy has lost a net 1.314 million jobs since the beginning of the Obama Administration.
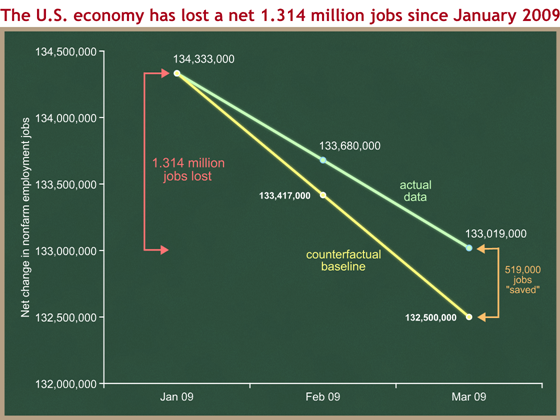
Suppose, however, that you had anticipated the situation would be even worse. Suppose you had thought that the employment level would be down to 132.5 million in March, rather than the actual 133.0 million. I’ll draw this as a new yellow line on the same graph and label it the “counterfactual baseline.” This is what you could argue you think the employment situation would have looked like, had no new policies been enacted. I should emphasize that the specific yellow line I show here does not represent any numbers cited by the Obama Administration. I have chosen these illustrative numbers to explain the concept.
The green line shows actual employment, and it includes the effects of policy changes enacted over the past two months. The yellow line represents the “counterfactual” – what you think (or claim) employment would have looked like had your policies not been enacted. You could argue that the 133.019 million people employed in March is 519,000 more people than would have been employed had your policies not been enacted. (Again, I emphasize so that nobody misconstrues me: I have chosen the numbers for the yellow line to illustrate the concept.) You would be trying to “frame” the numbers by measuring the positive orange change, rather than the negative red change.
In a world with no politics, that could be legit. I hope that the Administration’s policy changes will increase employment to be above what it would otherwise be, had those policies not been enacted. I did not like the so-called “stimulus” bill, and have big questions about the magnitude, efficiency, and timing of the economic benefits, but there is no question on the direction: these policies should be positive for employment, although over a much longer time period than that covered by this graph.
The problem is that the Administration can draw the yellow line anywhere they want it to be. Since the number of jobs “saved” (orange) is the difference between the green and the yellow lines, if you let me draw the yellow line, I can make the orange number as big as I want, and later claim credit for a large number of jobs saved. I would be arguing, “Sure things are bad. But I saved ____ million jobs from where it would have been had we done nothing. I would not be able to prove that this number is correct, but you could not disprove it either.” That’s why it is politically clever. It is specific, can be asserted, and can never be disproven.
As Greg wrote in February:
<
blockquote>You can measure how many jobs are created
This makes intuitive sense if you think about it on the personal level. If someone was unemployed on January 20th and they have a job on July 20th, you can understand why it would seem reasonable to count that as one additional job created since the beginning of the Obama Administration, even though policy may have had nothing to do with it.
If you had a job on January 20th, however, and you are in that same job on July 20th, does it seem reasonable to count your job as having been saved by the President’s policies? Maybe it was, but it is easy to see how that could be gimmicked by someone with a political incentive to make the numbers look good. How many of the 134.3 million people who were employed on January 20th would otherwise have lost their job? We’ll never know. A policy wonk would say that “you can neither prove nor disprove the counterfactual.”
You could correctly point out that the Administration has published an economic forecast that implicitly contains projections for employment, so we could at least hold the Administration to the yellow line they implicitly defined when they released their economic forecast in late February. The problem is that these official forecasts get updated every six months, and so the yellow line moves around. It will be impossible to tell how much of the yellow line’s movement from the February forecast to the July revision is legitimate changes in forecasting, and how much is political shading by an Administration that knows it will be judged on this metric. Note that I am not accusing this Administration of biasing their forecast, but instead trying to show that “or save” is an unreliable and misleading metric. We need a reliable factual metric that cannot be gimmicked or manipulated by political advocates from either side of the partisan fight.
The New York Times slipped the President’s phrasing into an editorial on Saturday that argued for even more spending and expansion of union-friendly policies:
It is painfully clear, however, that the law’s potential to create or save a few million jobs will not be enough to combat the current scale of unemployment.
Let’s return to the President’s statement from February 9th. Can we measure that?
Had he said that his Administration would create 4 million jobs, then we would have a simple metric: 134.3 million + 4 million = 138.3 million. Each month, we could compare the nonfarm employment level to 138.3 million to see if it was higher or lower than that goal.
Suppose, however, that a year from now this numbers is instead 133.3 million. If we measure this the way it has been measured for at least the past two Administrations, a fair reporter would write that “the economy has lost a net 1 million jobs since President Obama took office.” But the Administration could argue that employment would have been 129.3 million, and that they therefore saved 4 million jobs. And nobody could prove them right or wrong.
“Create or save” is unreliable and vulnerable to manipulation. Any time I hear it, I know that I am being spun.

