Yesterday I wrote about the history of tax increases since World War II, and about the battle over the total level of taxation. Now I want to turn to spending.
I am a low-tax guy. I have worked on tax issues for 12 of my 15 years in Washington, helping elected officials lower taxes and prevent tax increases. You can see a list of the taxes President Bush cut here. I would like to cut taxes far below where they are today, and I will continue to make the case that America is better off with a bigger private sector and a smaller government. America’s long run fiscal debate, however, is instead principally about whether we will allow future spending increases to force taxes to increase dramatically above where they are today.
I believe that America’s greatest economic policy challenge is the projected long run growth of spending on three programs: Social Security, Medicare, and Medicaid.
I would like to show you why I believe this, and how it relates to taxes.
Let’s begin by looking at federal taxes over time, as we did yesterday. You can see that they bounce around quite a bit. Some of that is from changes to tax law by Congress, and some because total revenues track economic growth fairly closely. What is remarkable about this graph is that the Federal government’s take from the U.S. economy has remained basically flat since the end of World War II.
All that fluctuation is distracting. I will remove it and leave just three trend lines for reference. By doing so I remove much noise and lose little information.
The blue and green dotted lines below represent averages for different periods: the green line is the 50-year average, at 18.1% of GDP. The blue line is the average of the last 30-years, at 18.4% of GDP. The post-WWII average is below the blue dotted line, at 17.9%.
The red dotted line is a trend line. It shows a 5-year moving average of the graph above. There is a very gradual upwards slope, growing about 0.025 percentage points per year (that’s two and one-half hundredths of a percent). Since the end of World War II, total federal taxes have therefore increased at a rate of about 1 percentage point of GDP every 40 years.
Now I will make a judgment call. I argue that the remarkable flatness of these lines is the result of a broad-based policy consensus, or at least a long-term balancing point of political forces, of how much in total taxes we as a nation are comfortable taking from those who earn it and giving to the federal government. Since World War II, between 17 cents and 19.1 cents of each dollar earned have gone to the federal government. The average is between 18.1 cents and 18.4 cents, depending on what time frame you choose. The number has been creeping up, by about one penny per dollar each 40 years. The highest that trend (the 5-year moving average) has ever been is just under 19.1 cents per dollar. My personal preference would be well below any of these numbers.
I will now take those trends and extend them for another 70+ years, to 2080. I am letting the red line grow at its historic long run trend of +1 percentage point every 40 years. I hate that trend.
What is nice about this graph is that we can zoom out from discussions of specific tax policies, and instead just focus on the total level of taxation. When current law has allowed taxes to creep up above the low 18s, the political pendulum swings and Congress “cuts” taxes. In aggregate terms, they are not really cutting taxes, they are instead preventing taxes from increasing as a share of GDP (which we learned yesterday is still an increase in real dollars taken by the government). Since the end of World War II, our political system has dynamically adjusted to change current law as needed to keep taxes in the low 18s as a percent of GDP. Unfortunately, the same appears to be highly unlikely for future spending.
Let us turn to historic total federal spending, again with a 5-year moving average trend line.
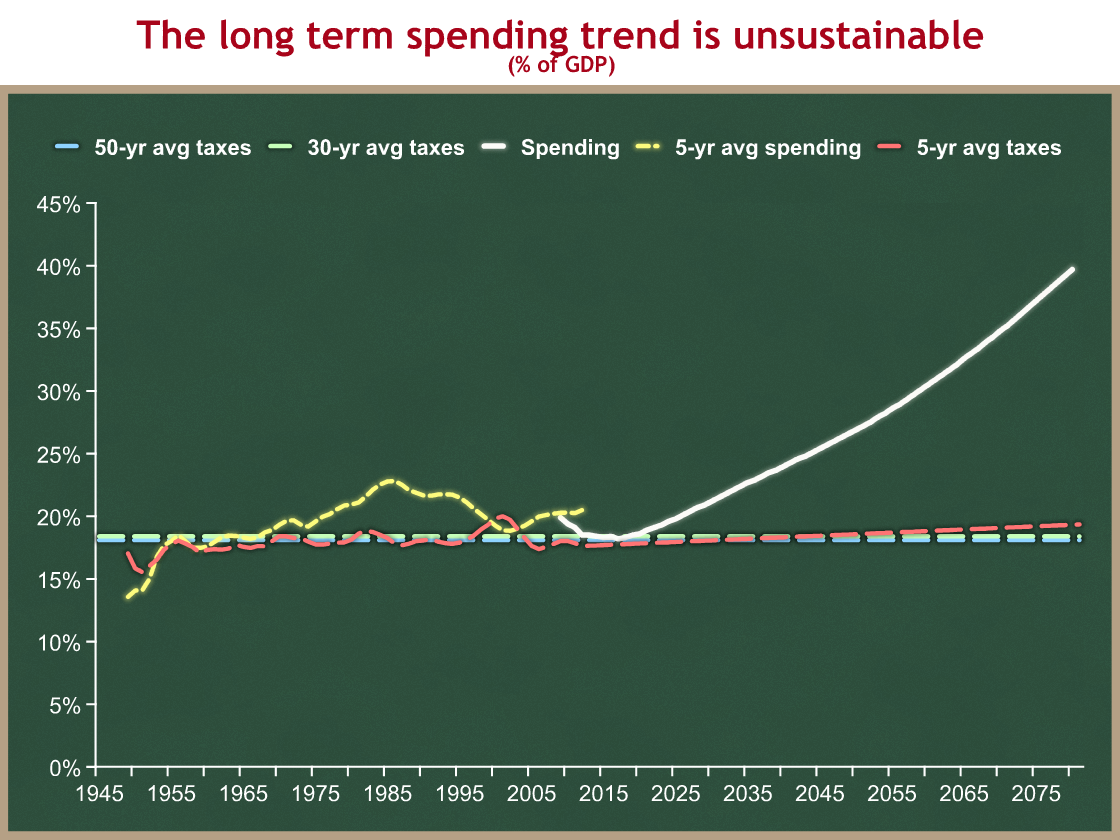
I am going to take the spending trend line and superimpose it on our earlier long-run tax graph. Yellow is spending, and all other colors are taxes:

You can see that we usually run budget deficits, since the yellow spending line is generally above the red tax line. If spending is greater than taxes, then the government is running a deficit and has to issue Treasury bonds to borrow funds from the private sector. The bigger the gap between the yellow spending line and the other tax lines, the bigger the budget deficit. Bigger deficits are bad for the economy. So are higher taxes.
Now all we need to do is add projected spending under current law for the long run. I will draw it in white.
Whoa! Hold on. What happened? The scale of the vertical axis changed, and that white long-run spending line is ridiculous. Surely that can’t be correct?
It is correct. If I could have you remember only one thing about economic policy, it would be this graph. You can see that the current law spending trend is clearly unsustainable in the long run. Under current law, total federal spending will grow steadily, reaching 40% of GDP by 2080.
The exact slope of that white spending line depends on a lot of assumptions, and there are esoteric debates about those assumptions. Some analysts would have it reach about 36% by 2080, and others in the mid 40s. Those are huge differences, but everyone’s line ends up looking similar, and the basic conclusion remains unchanged – the long-term spending line slopes up dramatically. The tax lines remain basically flat, as they have since the end of World War II. The difference between these slopes creates an unsustainable borrowing trend that, if left unchecked, would eventually cause the U.S. economy to collapse.
The white spending line I show here was done for me by OMB staff in 2007. Since then some spending assumptions have changed a bit, and we also have a new President. The dip you see in the early years of the white line will be shallower than you see here, because near-term spending will be higher than we assumed in 2007. Neither of these changes modify the basic conclusion.
For now, I will ask you to trust me that the increase in the white spending line is driven by the growth of three entitlement spending programs: Social Security, Medicare and Medicaid. I will show this later.
I posted yesterday about the battle on total taxation. The two ends of that debate, House Republicans and House Democrats, are separated by 1.4% of GDP on how much federal taxes they would collect. The House Republican plan would collect just under 18% of GDP in taxes. The President’s budget would collect just under 19%, and the budget passed through the House by Democrats would collect just over 19%. In each case, however, that is just setting the level of the flat flat line. Nobody is talking about a permanent upward change in the slope of tax lines, so you’re arguing about whether you should be a smidge below that flat blue line, or up to 0.8 percentage points above the flat green line. Either way, they are all flat tax lines.
Even the long-term red tax trend line, which slopes slightly upward and which I hate, hits 19.4% in 2080. That is higher than taxes have ever been for a sustained period of time, and it is less than half of projected spending in that year.
Even the highest level of taxes imagined in the current short term debate does no good in addressing this long-term fiscal problem, because the current law spending line will just keep growing above that, forever. At some point you have to bring the spending and tax lines together, or at least to be roughly as close as they have been in recent history. While undesirable, we can sustain deficits in the 2-ish% of GDP range indefinitely without the economy collapsing. We cannot sustain deficits that grow and keep growing as a share of the economy.
To close that gap, we have to reduce the slope of the spending line. Raising taxes as a share of the economy is an upward shift in the flat tax lines. This can delay the day of reckoning, but it cannot solve the problem. And raising taxes causes economic damage of its own.
America’s long run fiscal problem is the projected future growth of spending under current law. If we do not prevent that white line from growing as you see above, our economy will eventually implode, no matter what we do with taxes.