Monday I showed you President Obama’s proposed medium-term deficits. Yesterday I compared those with Chairman Paul Ryan’s medium-term deficits, then did the same comparison for medium-term debt. Today I’d like to do the same thing but with a longer timeframe.
In case you missed it here are the earlier posts in this series:
- President Obama’s proposed medium-term deficits
- The Ryan budget proposes lower deficits and less debt than the Obama budget
- How will President Obama respond to Chairman Ryan’s lower deficits and less debt?
There is uncertainty in every budget projection, and every projection requires making certain assumptions. The longer your timeframe the more your projection is vulnerable to those uncertainties and assumptions. In addition the policy specificity in both plans declines significantly after 10 years.
Despite all these caveats, it makes sense to look at long run projections. Yes, they are inaccurate, and yes, things will change in both the economy and policy. But that’s no reason to ignore our best guess/estimate of what trends each leaders is proposing. As long as we don’t assign too much false precision to multi-decade projections we can still draw valuable conclusions from these long-term estimates.
Here is the long-term deficit comparison.
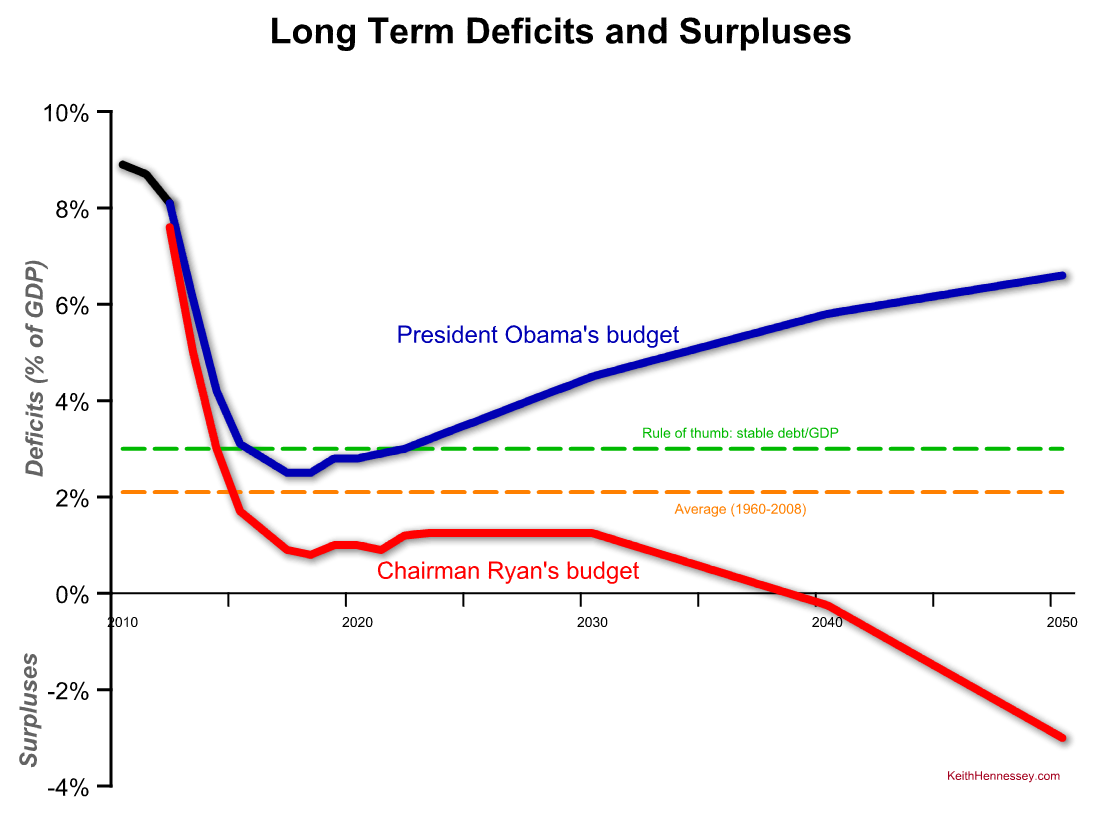
- Once again you can see that both budgets project declining deficits (relative to the economy) for the next six years (through 2018).
- Ryan’s deficits then tick up a big to 1.25%, hold flat until 2030, then begin a steady decline, reaching balance in 2039 and a 3% surplus by 2050.
- After ten years President Obama’s deficits begin to climb steadily over time, reaching 6.6% of GDP by 2050.
I am using each advocate’s claims about their long-term projections. The impartial referee has not scored the policy effects of either proposal beyond 10 years, so we have to rely on the advocates’ claims.
Would we reach a 3% surplus in 2050 if the Ryan budget were enacted in full? Certainly not. Would we hit a 6% deficit in that same year under the President’s budget? No. At 40 years out, each is little more than an educated guess.
But the long term lessons of this graph are not guesses.
- Chairman Ryan proposes stable deficits of a bit over 1% of GDP, below the historic average deficit, followed by a gradual path to balance and eventually to surplus.
- President Obama’s budget would result in deficits that are always greater than the historic average, and that would cause debt/GDP to increase again beginning about 10 years from now.
- The gap between the two proposed deficit paths widens over time.
- President Obama’s proposed deficit path is unsustainable. Our economy can tolerate high and even very high deficits for a short time. High and steadily rising deficits like those described by the blue line cannot be sustained. Something in the economy will break.
Now let’s look at long-term debt. Debt is, of course, the accumulation of annual deficits and occasionally surpluses. Deficits measure an annual flow while debt measures a stock.
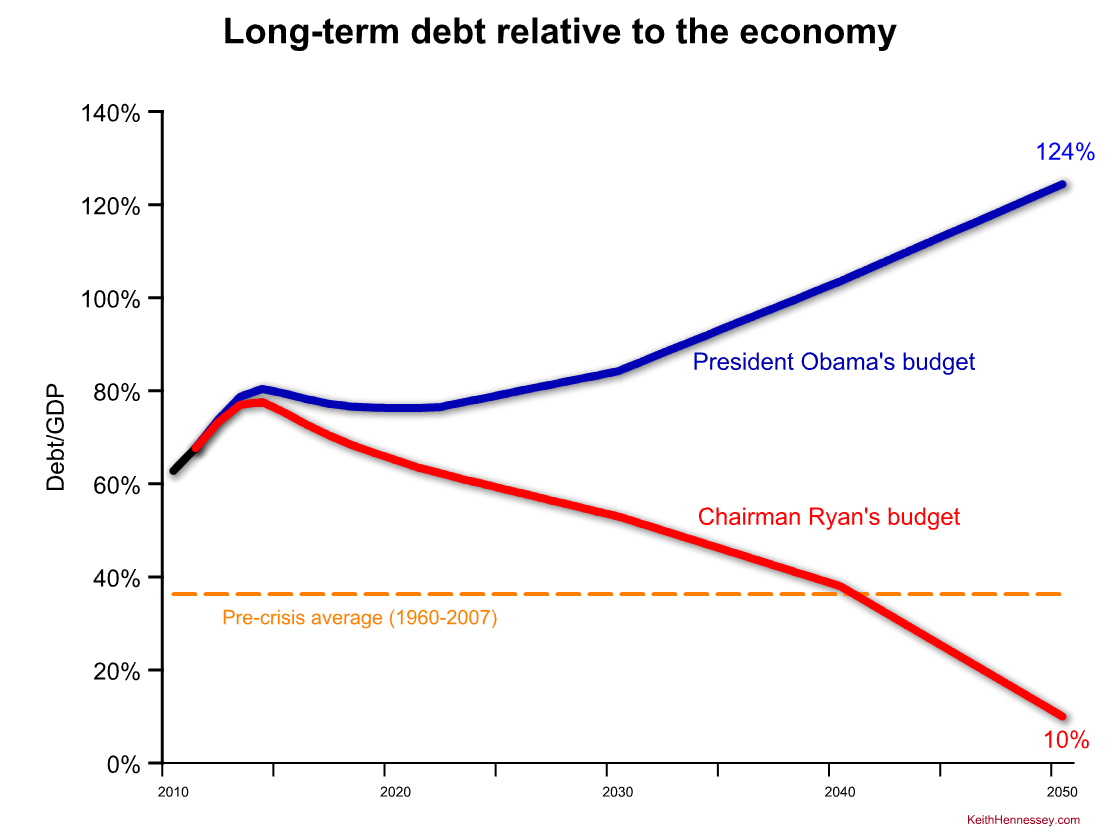
The divergent paths are even clearer here. Under both plans debt/GDP would increase this year and next, then begin to decline.
Chairman Ryan’s plan would result in debt/GDP steadily declining over time. It would take decades to return to a pre-crisis average.
President Obama’s plan would result in debt/GDP stabilizing by the end of this decade, then steadily and forever growing. At some point, and no one knows when, that debt becomes unsustainable.
Again, please don’t get too wrapped up in the point estimates I have shown for each plan for 2050. The point is that the Obama debt would eventually break 100% of GDP and keep climbing, and the Ryan debt would steadily decline over time. The gap between the two is significant and ever-increasing.
The red path is economically sustainable, the blue path is not.