The President’s proposed deficits and “primary balance”
Today we’ll look at President Obama’s proposed deficit path, as yesterday we looked at his spending and revenue paths.
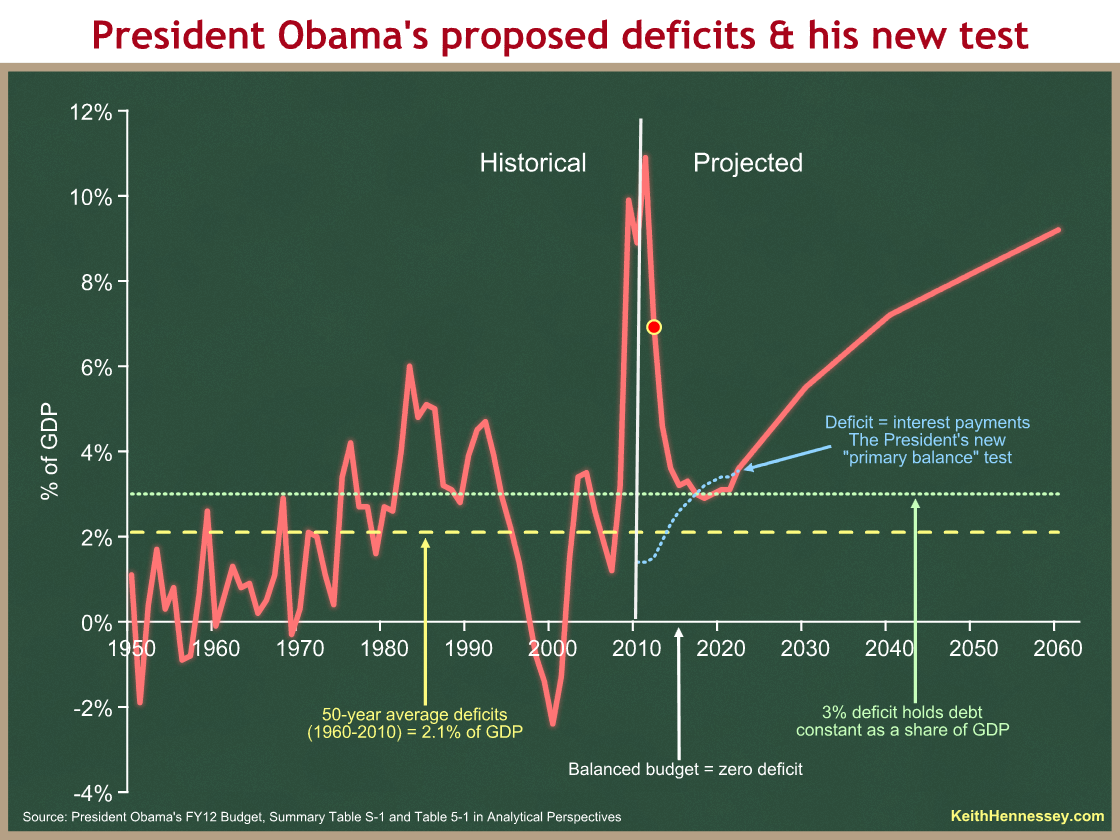
The red line on this graph compares the last 50 years of deficits with the next 50 years under President Obama’s proposed policies.
The vertical white line at 2011 separates the past from the projected future.
This graph is busy because we have four different bases for comparison. The first three are standard metrics.
- The white x-axis would be a balanced budget.
- The dotted yellow line shows the 2.1 percent of GDP average deficit over the past 50 years.
- The dotted green line is at 3 percent. Above the dotted green line, debt will grow faster than our ability to pay it.
- The dotted blue line is the President’s proposed new test for himself and the country. He now defines success as getting red below dotted blue.
The President proposes a 7 percent budget deficit for 2012 (the red dot). His deficits would bottom out at 2.9% seven years from now, in 2018, and then rise steadily forever.
The President proposes deficits that are in each year well above the historic average (dotted yellow line).
Until 2015, our debt/GDP ratio will increase every year. For a few years beginning in 2015, the President’s budget would stabilize debt as a share of the economy.
You can see our severe problem in the large, sustained deficits that are projected to grow forever, beginning a few years from now. We used to call this a long term problem.
Current short term deficits are high enough to be economically damaging. That long term deficit path is unsustainable. Something will break.
The President’s budget doesn’t even pretend to shoot for balance, or to reduce deficits to the historic average. He has abandoned those goals, and instead draws a new dotted blue line that grows rapidly over time, and then defines success as getting deficits below that.
Here is the President in a press conference Tuesday.
Our budget … puts us on a path to pay for what we spend by the middle of the decade.
… by the middle of this decade our annual spending will match our annual revenues. We will not be adding more to the national debt. So, to use a — sort of an analogy that families are familiar with, we’re not going to be running up the credit card any more.
I will deal with the […]
