A new claim about job creation appears to be bubbling up through the Democratic ranks. Here is the clearest statement of that claim, from Rep. Debbie Wasserman Schultz (D-FL) on Stuart Varney’s show:
On the pace that we’re on, with job creation in the last four months, if we continue on that pace, and all the leading economists say that it is likely that we will, we will have created more jobs in this year than in the entire Bush Presidency.
Ms. Wasserman Schultz is picking her timeframes carefully, in particular by ignoring the four million jobs lost during the first 11 months of a Presidency that is so far 16 months old.
Even today, after five straight months of job growth, three million fewer people are working than when President Obama took office. That’s hardly something to brag about.
And looking just at last month’s strong net increase of 431,000 jobs, we see that nine out of ten net new jobs were temporary government jobs for census takers. We all hope the pace of private job creation accelerates, but it’s too soon to declare this a strong and consistent employment recovery or to project its trend into the rest of the year.
Let’s look at how Ms. Wasserman Schultz justifies her claim.
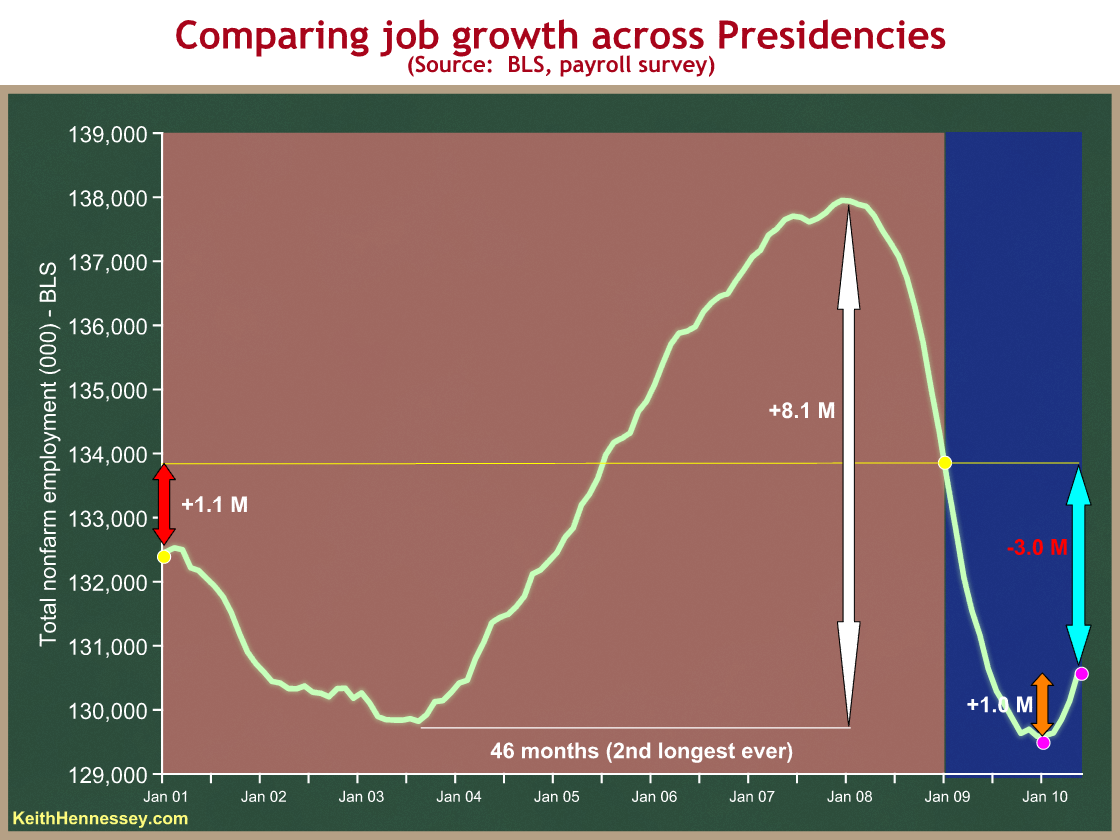
I have colored the Bush Presidency red and the Obama Presidency blue.
You can see two yellow dots in January 2001 and January 2009, and a thin yellow line extended so we can measure the difference between the two. The red arrows show that, if you measure only endpoint to endpoint, 1.1 million net net jobs were created during the Bush Administration (I’m using the payroll survey in all cases).
But this analysis misses most of the story. We can see a steady employment decline from early 2001 through mid-2003, followed by a steady, strong, and sustained period of job growth for almost four years. This 46 month period is the second longest in recorded history for sustained job creation in the U.S., and more than eight million jobs were created during this period (the white arrows). A mild recession began in late 2007, followed by a severe contraction in the second half of 2008 and continuing into the Obama Presidency.
Compounding the chicanery, Ms. Wasserman Schulz measures the Obama job creation beginning with the first pink dot in December 2009. Her conclusion is based on the orange arrows and her guess about how they will grow throughout this year. She’s ignoring the four million decline in employment from January 2009 (despite the stimulus), and she’s ignoring that we’re still three million jobs shy of where we were when President Obama took office. If she were to apply the same methodology to President Obama as she did to President Bush, she’d be comparing +1.1 M (Bush) with -3.0 M (Obama). But that wouldn’t look quite as good for her case.
Measuring employment either presidency by observing only the start and endpoints ignores a lot of important information and tells a misleading story. Comparing the entire Bush presidency with only the good news part of the Obama presidency is absurd.
Many economists prefer to compare economic statistics from one business cycle to the next – from peak to peak, or from trough to trough. Since business cycles don’t match political terms, this means that comparisons across presidencies are analytically difficult and often misleading. When an advocate like Ms. Wasserman Schultz compounds this by choosing her window to make her point, we’re at the mercy of her choice of timeframe, which is often chosen to justify a political argument.
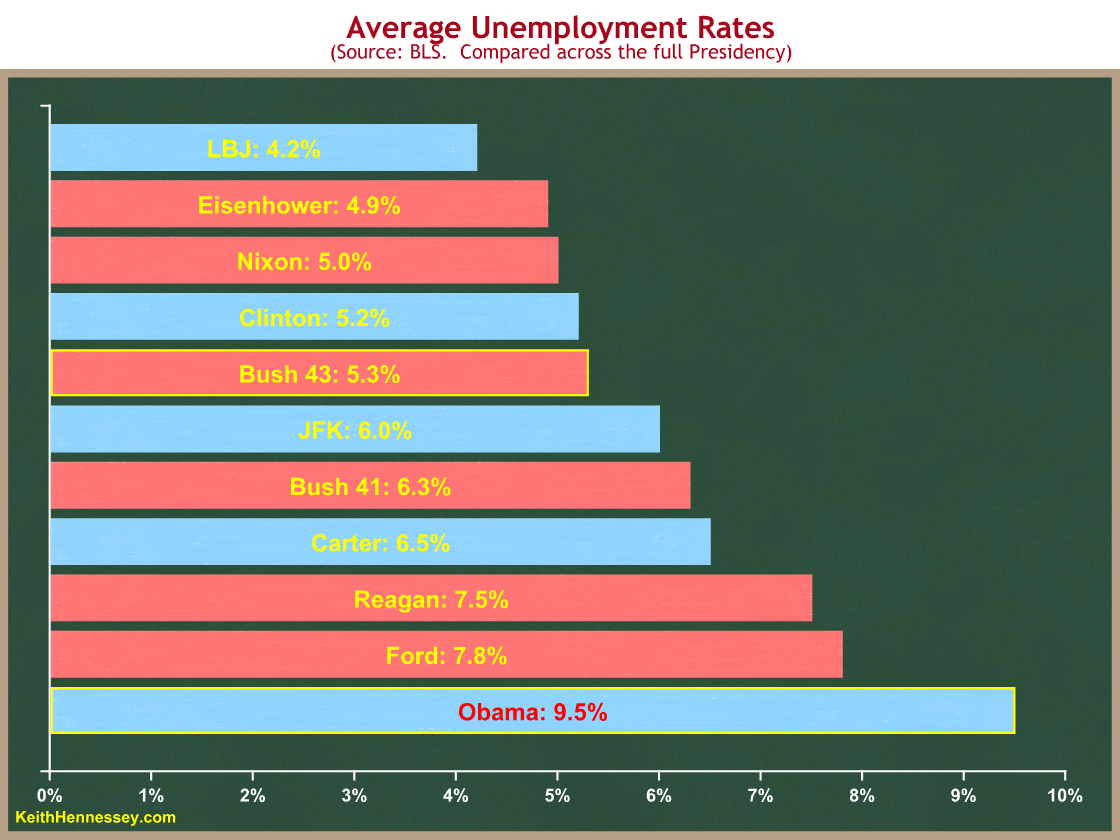
Since the policy and political debate force us to compare economies between elected terms, we need a better metric. The average unemployment rate is probably the best and fairest way to compare employment over time between Administrations. Since the labor force grows each year, comparing the number of jobs created in timeframes many years apart is misleading. The unemployment rate largely adjusts for these demographic trends because it is measured as a share of the labor force. And using the average unemployment rate over an entire Administration allows us to avoid endpoint biases and games and to more fairly compare Presidencies.
If Ms. Wasserman Schultz wants to use this better and fairer metric to compare the employment picture between the entire Bush presidency and the Obama presidency so far, I’m game:
President Obama’s 9.5% average unemployment rate is measured over a relatively short timeframe, and we all hope that average declines as the economy recovers and many more new jobs are created. Still, a fair comparison shows a strong 5.3% average unemployment rate for the Bush Presidency, and Obama partisans may want to wait for a lot stronger job growth before trying to compare the Obama employment record with that of President Bush.

