This morning the Commerce Department released their initial round of data for second quarter (Q2) GDP. Real GDP shrank at a 1.0 percent annual rate in the second quarter of this year. As a reminder, this does not mean GDP shrank 1 percent in the second quarter. It means that it shrank at a rate that, if extended through a whole year, would cause the economy to shrink 1% over the course of that full year.
When the economy is performing well it grows a little faster than 3% per year. Coming out of a deep recession you would hope for even faster growth, since your starting point is so low.
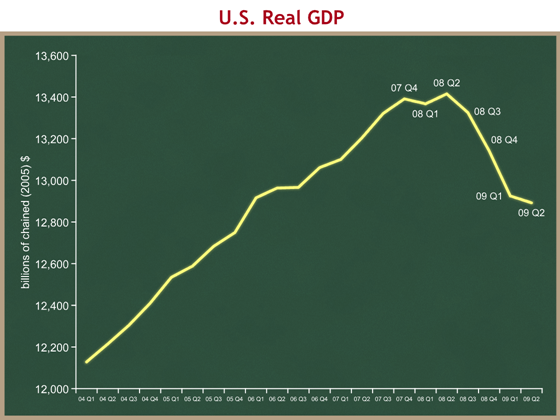
First let’s look at how things have changed over time. We can learn a lot from a simple picture. As always, you can click on any graph to see a bigger version.
The National Bureau of Economic Research (NBER) is the body that officially defines when recessions begin and end. Technically, they pick points that represent “peaks” and “troughs,” and then the recession is the time between a peak and a trough. NBER said that the peak was in the fourth quarter of 2007, so we say that’s when the recession began.
What jumps out at me from this graph is the difference between two parts of the recession. The graph bumps around between Q4 2007 and Q3 2008, then falls off a cliff. The press commentary (including from “sophisticated” analysts) talks about the recession that has lasted since the fourth quarter of 2007. While technically correct, that loses a tremendous amount of information. The severe recession, the one that has caused so much pain, really began in September 2008 when the financial crisis hit hardest. The current recession has been a mild recession for three quarters, interrupted by a severe financial shock which triggered three quarters (so far) of severe recession. Let’s hope today’s news means we are through the severe part and into a third phase.
It’s important to remember that the numbers you hear reported are growth rates. We learned today that U.S. GDP shrank 6.4% in the first quarter of this year, and another 1.0% in the second quarter. You can see how the line slopes downwardly sharply ending in the “09 Q1” point – that downward slope is the 6.4%. The economy shrank in the second quarter, so the line is still going down. But it didn’t shrink as much, so the line isn’t sloped downwardly as sharply as over the past few quarters. That gentler downward slope is today’s -1.0%.
The business news channels are treating today’s -1.0% number as fairly good news, for two reasons. The recession is slowing down – we’re still going down, but not as rapidly. Everyone hopes that this signals that a “bottom” (on the graph) is coming soon, and that things will soon turn positive. In addition, the -1.0% is a little less worse than markets expected. The consensus market expectation was for -1.5%, so in this case the bad news is a little less worse than expected, and financial markets treat that as a good thing.
This fits with the President’s new language on the economy, used for the first time a few days ago. They have (finally) found their new tone on the economy, and I think they hit a sweet spot from a communications perspective:
So, we may be seeing the beginning of the end of the recession. But that’s little comfort if you’re one of the folks who have lost their job, and haven’t found another.
The first sentence is optimistic but cautious. The second sentence is compassionate. They have found language that allows the President to sound optimistic and look good if things gradually improve over the next few months, but that doesn’t get him in too much trouble if things go south, and doesn’t make him look out of touch with the painful employment picture. It’s not risk-free: if the jobs market data continues to get worse, he risks having looked too optimistic. This is one of the harder balancing acts for the President and his advisors.
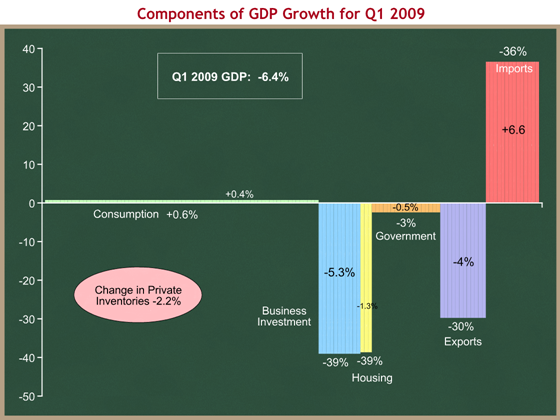
Let’s return to the numbers. For comparison we’ll begin by reviewing what happened in the first quarter of 2009. I have updated this graph to reflect today’s revisions to Q1 09 data.
We can see that in the first quarter:
- The economy shrank at a 6.4% annual rate. This is revised downward from the previous estimate of -5.5%.
- Consumption, which accounts for about 70% of the economy, was just above flat. It grew at a 0.6% rate, contributing 0.4 percentage points of growth.
- Business investment and housing tanked, shrinking at a 39% rate. Combined they account for a -6.6% decline in the overall GDP growth rate.
- Exports shrank, shrinking GDP, but imports shrank as well. Because imports subtract from GDP, the combination of the two was a net positive for overall growth.
- Firms weren’t building up inventories, and that sucked out a lot. Government was a slight drag.
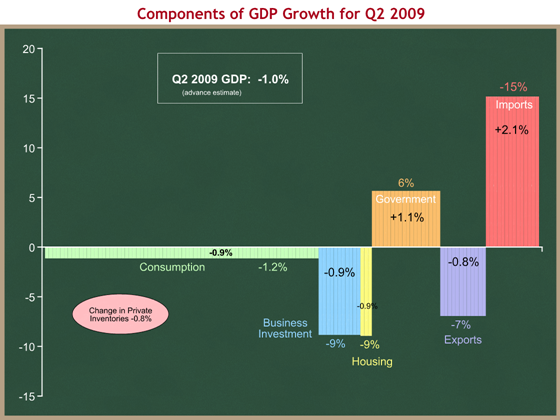
Now let’s look at what happened in the second quarter of this year. I think it’s most useful to compare the Q1 and Q2 graphs. You don’t even really have to look at the numbers – just the colors and heights of the columns should tell you a lot.
We can see that in the second quarter:
- The economy shrank at a 1% annual rate.
- Consumption shrank at a 0.9% annual rate, subtracting 1.2 percentage points of growth. UH-OH.
- The huge change is in investment, both in businesses and housing. They’re still shrinking, but at a 9% annual rate, rather than the 39% annual rate from Q1. These two components knocked off 6.6 percentage points in Q1, and now they’re knocking off 1.8. That’s the biggest reason for the change, and it’s the big good news in this report.
- The same is true for exports and imports. Exports shrank at a 7% rate in Q2 compared with 30% in Q1. Exports are still declining, but not as rapidly as they were.
- Government spending is now contributing to GDP growth. There’s a fairly big swing from Q1 to Q2.
- Inventories are being drawn down, but not as fast as they were in Q1.
The big change in government spending surprised me. Is the stimulus actually working that fast? It turns out that 60% of the growth from Q1 to Q2 is defense spending, so no. 25% is increased investment by State & local governments. It’s possible that some of that latter amount is higher because of anticipated stimulus funds from the feds, but I’d be surprised if much of it was.
Were it not for that -0.9% in consumption, this would be an across-the-board improvement from Q1. On CNBC this morning CEA Chair Dr. Christina Romer was asked about the decline in consumption, and she said there isn’t a huge difference between a +0.6% in Q1 and a -0.9% in Q2. I hope she’s right, but fear she may not be. That change may be statistical noise, but remember that our labor market is still incredibly weak. If people don’t have jobs, they aren’t getting paychecks, and they won’t spend much. We have to watch the labor market, not just the stock market.
Things to look for:
- Jobs Day is a week from today, when we’ll see what happened to the labor market in July.
- Sometime in August the Administration will release a revised economic forecast as part of the Mid-Session Review of the President’s Budget.
- Dr. Romer said this morning that the Administration still expects positive GDP growth “in the second half of this year.”


