The President and his Budget Director Peter Orszag argue they are being fiscally responsible when they support a massive new health entitlement. They are proposing savings in Medicare and Medicaid, and they are proposing ephemeral long-term policy changes that they argue will save money. The savings are insufficient to offset the new spending, and CBO says their long-term changes are insufficient to save money in the federal budget.
In last Monday’s Financial Times, President Obama’s Budget Director Peter Orszag wrote:
Healthcare cost growth dwarfs any of the other long-term fiscal challenges the US faces. Nothing else we do on the fiscal front will matter much if we fail to address rapidly rising healthcare costs.
Although his focus is too much on the far future (e.g., 2050, rather than 2020 or 2030), Director Orszag is correct that, if we don’t slow the growth of federal health spending, the U.S. budget and economy will in time collapse.
Director Orszag therefore deserves credit for making Congress’ job much harder last Wednesday, when he established a new Administration test for health care legislation by opening his blog post like this: (emphasis added)
As I have written before, the Administration is committed to the principle that health care reform must be deficit neutral over the next decade (as well as being deficit neutral in the 10th year alone).
Despite his “As I have written before,” I think the “10th year test” is new for the Administration. It jumped out at me, and I have been unable to find any previous references to it by Director Orszag or anyone else. Maybe they have been communicating it privately to their allies in Congress.
I commend Director Orszag for setting forth this new test, which I believe he intends as a proxy for addressing the long-term health spending trend. It’s an insufficient proxy, but it’s better than nothing. If your legislation does not increase the deficit in the last year that you measure budgetary effects, then you can argue that your legislation isn’t making things worse in the long run.
This is an insufficient proxy if Congress uses certain tax increases to close the gap, because of the difference in long-term growth rates between health spending and revenues. I’ll cover that another time. Today I want to examine the size of the gap between Director Orszag’s test and legislation being developed by Congressional Democrats. CBO and the Joint Tax Committee estimate the effects of legislation over a 10-year budget window. The “tenth year” for our purposes is 2019.
As a preview, here’s my conclusion:
Combining Kennedy-Dodd with all of the President’s proposed Medicare and Medicaid savings would make America’s long-term entitlement spending problem much worse than under current law.
This conclusion may be obvious if you are closely following this debate. But the President and his Budget Director continue to assert that they are being fiscally responsible by supporting this new entitlement. Those repeated assertions demand a rigorous analytical response. I am going to walk through this step by step, to try to prove they are wrong.
Let’s look at some pictures.
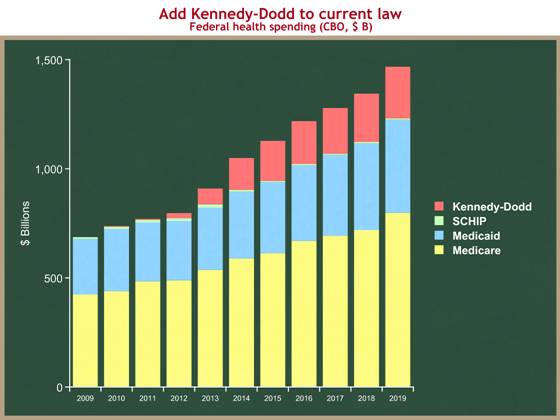
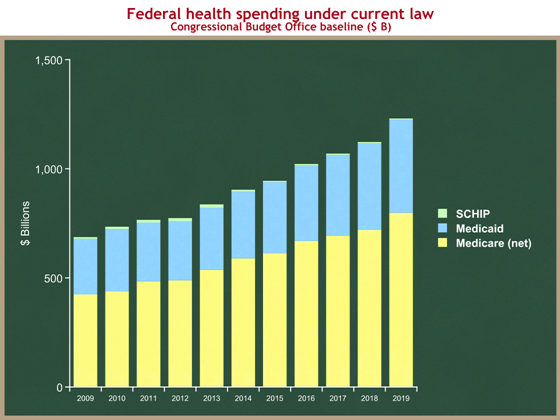
Here is federal health entitlement spending under current law. The graph below shows huge programs growing at an unsustainable rate. Under current law, spending on these three programs would grow from $676 B this year, to $1,228 B in 2019. (And I think CBO is being optimistic.)
As always, you can click on any graph to see a larger version.
 Here’s technical stuff for the budget wonks:
- Source: CBO’s Baseline Projections of Mandatory Outlays (Table 1-8)
- Medicare spending is net of premiums
- These are federal expenditures, so Medicaid is the federal share.
- CBO uses baseline SCHIP spending, which drops from $14 B in 2013 to $6 B by 2015. This is unrealistic, but it helps make the Democrats’ job easier, so I’ll leave it this way for now.
Let’s add the proposed new health spending in the Kennedy-Dodd bill, as scored by CBO. You can see it would significantly increase federal health spending.
- Source: page 10 of CBO’s June 15, 2009 letter to Chairman Kennedy
- I’m showing net increased health spending from Kennedy-Dodd. On the next graph I will include the effects of higher taxes under Kennedy-Dodd.
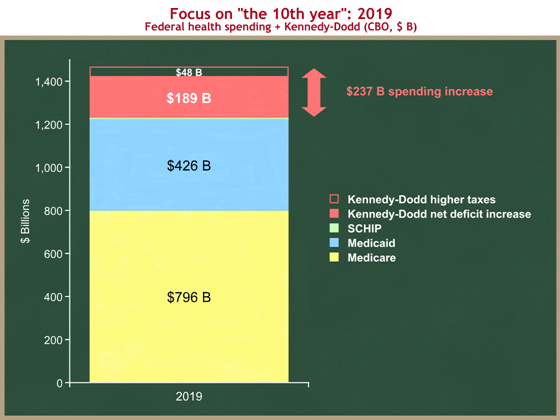
Now let’s focus on the 10th year, the new test defined by Director Orszag. The following graph shows the stacked column just for 2019 from the prior graph, with one addition. While the red on the prior graph showed only health spending, now I want to include the effects of Kennedy-Dodd on taxes as well. Kennedy-Dodd would result in some people buying health insurance outside of employment. If they were to do so, that income would be taxable, and the federal government would collect more in tax revenues. So while Kennedy-Dodd would increase health spending by $237 B in 2019 (and that’s what’s displayed in the graph above), from a budget deficit standpoint, that would be partially offset by $48 B in higher taxes.
I’m not just a low-deficit guy, I’m also a small(er) government guy. I also focus on the medium and long run, where the spending growth rates overwhelm the tax growth rates. So I think the $237 B figure is a better measure of Kennedy-Dodd’s impact. I realize that others don’t share my concern about size of government, and instead focus just on the budget deficit. Even by this measure, Kennedy-Dodd makes things $189 B worse in the 2019, the year chosen by Director Orszag.
- Source: Same as above, page 10 of CBO’s June 15, 2009 letter to Chairman Kennedy.
The Administration, and in particular Director Orszag, argue that the higher health spending from expanding taxpayer-financed health insurance coverage to millions of people will be offset by three factors:
- new proposals to slow the growth of Medicare and Medicaid spending;
- new proposals to raise taxes; and
- in the long run, policy changes that will slow the growth of private health care spending, and which they argue will flow into savings in federal health care programs.
In looking at the 10th year, factor (3) is automatically incorporated into CBO’s estimate of Kennedy-Dodd. CBO gives Kennedy-Dodd no credit to slowing the growth of private health care spending. If they did, those savings would already be built into the above graph. And the Administration does not claim that any of its desired policy changes would produce savings in that 10-year period. If they did, those savings would be built into their projections for factor (1). So for this exercise, we can effectively ignore factor (3).
I will set aside the Administration’s proposed tax increase for the moment. I will return to it.
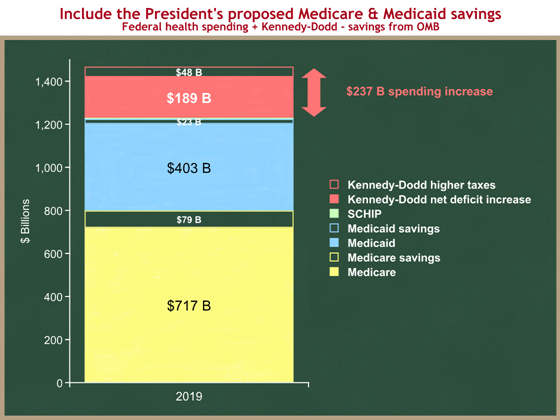
Let’s now assume that Congress adds to Kennedy-Dodd all of the Administration’s proposed Medicare and Medicaid savings. According to OMB, that’s about $628 B of Medicare and Medicaid savings over the ten-year period. The first half of that was in the President’s budget. The President proposed the second half, $313 B of the total, ten days ago with much hoopla about his commitment to offset higher health spending. I wonder if he knew that his proposals would come up short.
Now it’s unreasonable to assume that Congress will adopt all of these savings proposals, but I’m going to give them and Director Orszag the benefit of the doubt and assume they do.
On the next graph I have erased the parts of Medicare and Medicaid spending that would result from the President’s savings proposals in those programs. These green areas show the effect in 2019 of the President’s proposed Medicare and Medicaid savings.
Why is it so little? Because while the President proposed $628 B in savings over ten years, the amount saved in the tenth year is much smaller. His proposals would reduce federal Medicaid spending by about $23 B in 2019, and would reduce Medicare spending by about $79 B in that same year. That’s a lot, but not compared to the proposed spending increases. The next graph will collapse the stack to eliminate those green gaps.
- Source: “Paying for Health Care Reform,” White House Medicare fact sheet, released June 12, 2009.
- Source: Table S-6 in the President’s budget (pp. 127-128).
- I did not have a 10-year savings stream for the Administration’s second tranche of savings proposals, so I assumed the timing would be distributed the same as in their first tranche. I am confident that’s a reasonable assumption.
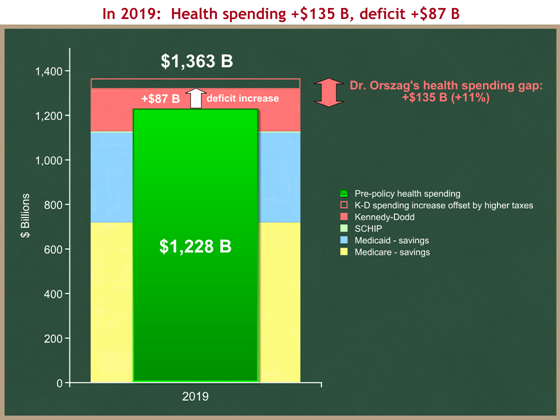
Our last graph will be a before-and-after. The stacked column in back (yellow-blue-red) shows the net effects of current law, plus Kennedy-Dodd, minus all of the President’s proposed Medicare and Medicaid savings. It’s the graph from the last chart, with the bars collapsed together to account for the savings. The green bar in front shows current law spending – it’s the same as the 2019 bar in the very first graph.
You can see the gaps:
- Health spending would be $135 B higher in the tenth year (2019) under (Kennedy-Dodd + President’s savings) than it would be under current law.
- Accounting for the higher taxes that would result from Kennedy-Dodd, the deficit would be $87 B higher in 2019 than under current law.
The Administration has also proposed raising taxes to pay for higher health care spending. The President’s budget proposes to raise taxes for high-income tax filers who itemize their deductions. If Congress were to consider this proposal, it would raise $46 B of revenues in 2019, leaving Director Orszag with a $41 B gap in 2019.
There are two caveats to this proposal:
- It causes the “tenth year” test to lose meaning. In the long run, federal health spending is growing faster than the economy. The revenues raised by this proposal would grow at the same rate as the economy. So closing the 2019 gap through this kind of tax increase means that you still have a long-term health spending problem.
- Congress has rejected this proposed tax increase. They are considering others, almost all of which fall into caveat #1. The only one that does not is limiting or repealing the exclusion for employer-provided health insurance, which grows faster than the economy.
Conclusions
- Kudos to Director Orszag for trying to focus the debate on long-term federal health spending trends.
- Kudos to him for setting a new “10th year test” for health care legislation. I hope the White House doesn’t undercut him in its desire to get a bill to the President’s desk.
- The 10th year test is an imperfect and misleading proxy for our long-term health spending problem, if you use tax increases to close the 10th year gap (excepting the employer-provided exclusion).
- Kudos to the President for proposing additional Medicare and Medicaid savings.
- The Congress will not adopt all of those savings, and they have rejected his proposed tax increase.
- Even if they were to adopt all of his proposed Medicare and Medicaid savings, Kennedy-Dodd would fail the 10th year test by about $87 billion, and it would increase federal health spending by 11% in 2019, or about $135 B.
- As a measure of our Nation’s long-term fiscal problems, the +11% / +$135 B is a better metric.
- Combining Kennedy-Dodd with all of the President’s proposed Medicare and Medicaid savings would make America’s long-term entitlement spending problem much worse than under current law.
